
Trading Insights
Research from the desk
Every post is backed by a real data study — measured on the tape, not folklore. Market structure, execution intelligence, order flow, and short-selling mechanics.
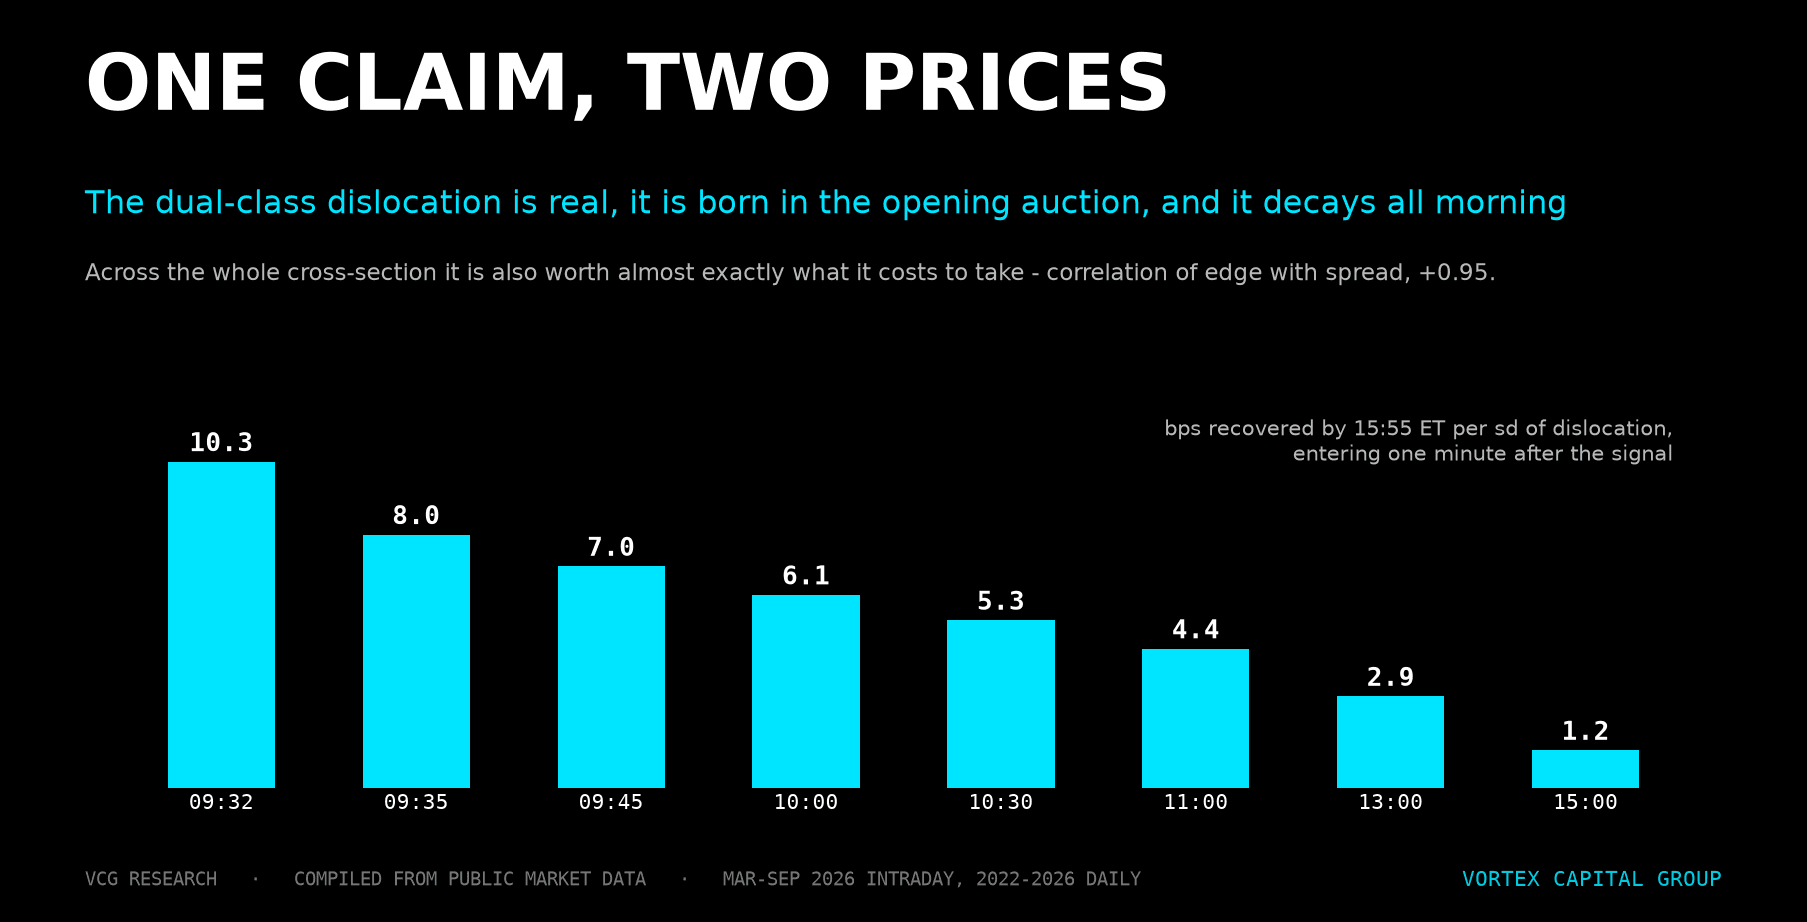
One Claim, Two Prices: The Dual-Class Arb Is Real, and It Costs Almost Exactly What It Pays
Twelve US issuers list two share classes with an identical cash claim. The deviation between them mean-reverts on every liquid pair, on none of the placebos, and in the wrong direction on the one pair whose dividends differ - about as clean a demonstration that arbitrage exists in US equities as the tape allows. Then the cost table decides who gets to have it. Across the cross-section, the size of the dislocation correlates +0.95 with the cost of removing it.
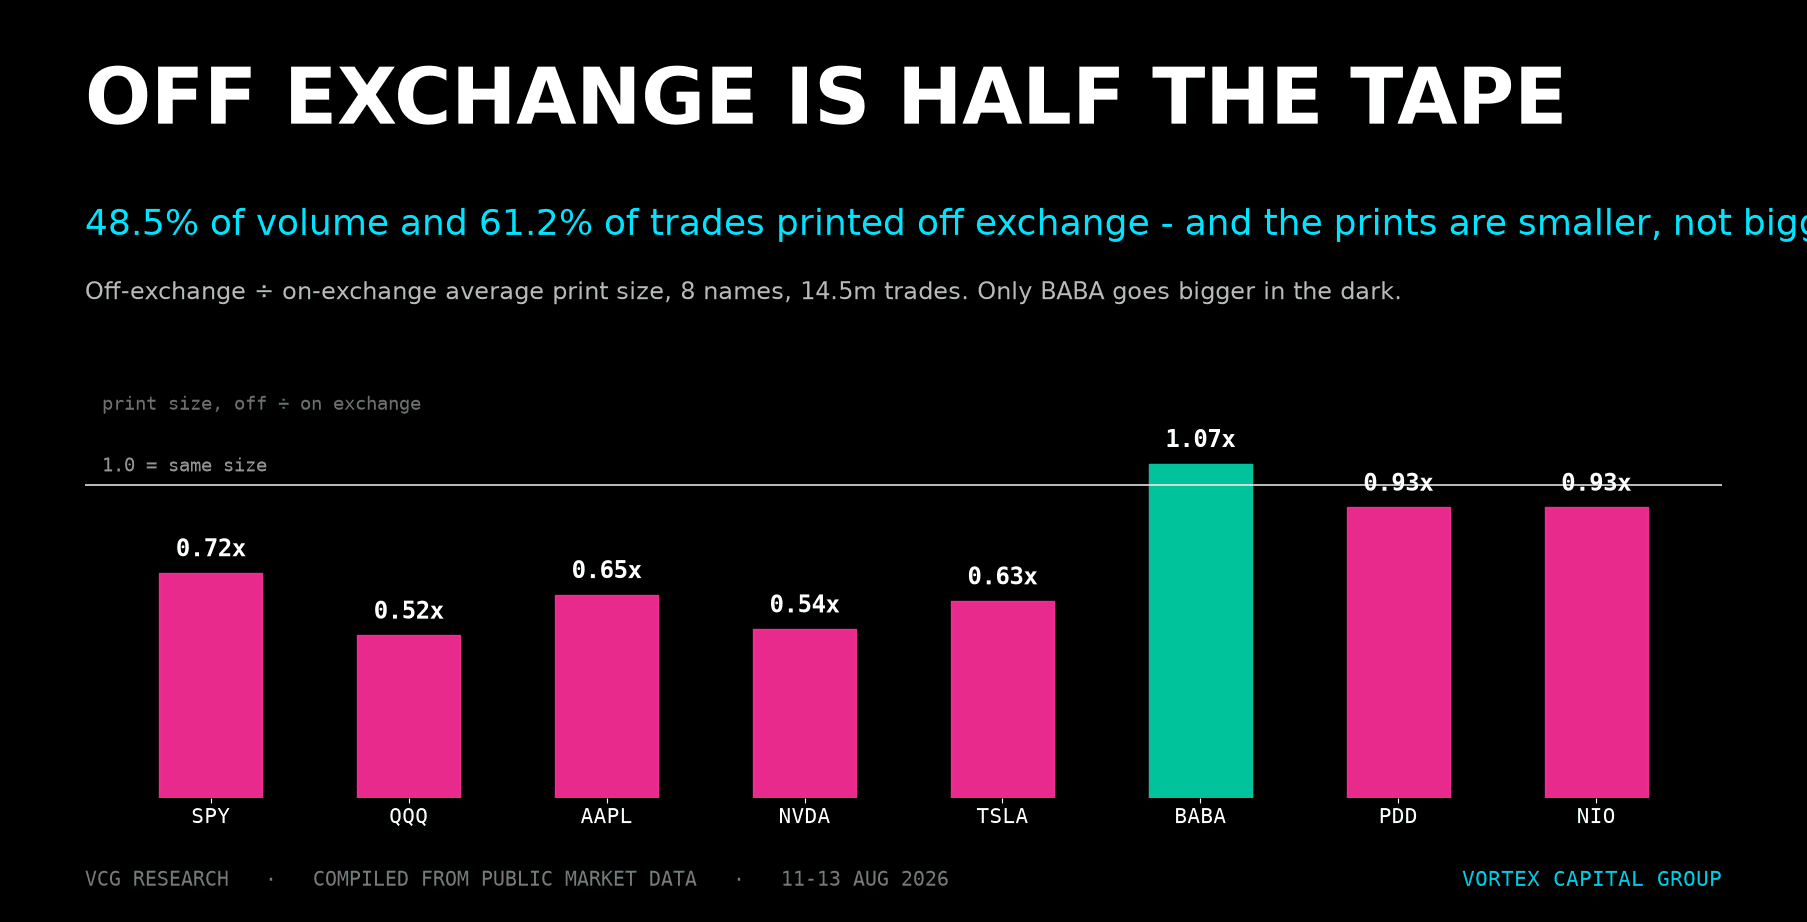
Reading US Dark-Pool Data: What the TRF Tape Shows, and What It Hides
Off-exchange is 48.5% of volume and 61.2% of trades across eight liquid names. But the off-exchange print is SMALLER than the lit print - 0.52x to 0.72x in the megacaps - because exchange code D is mostly retail internalization, not institutional blocks. The China ADRs are the exception.
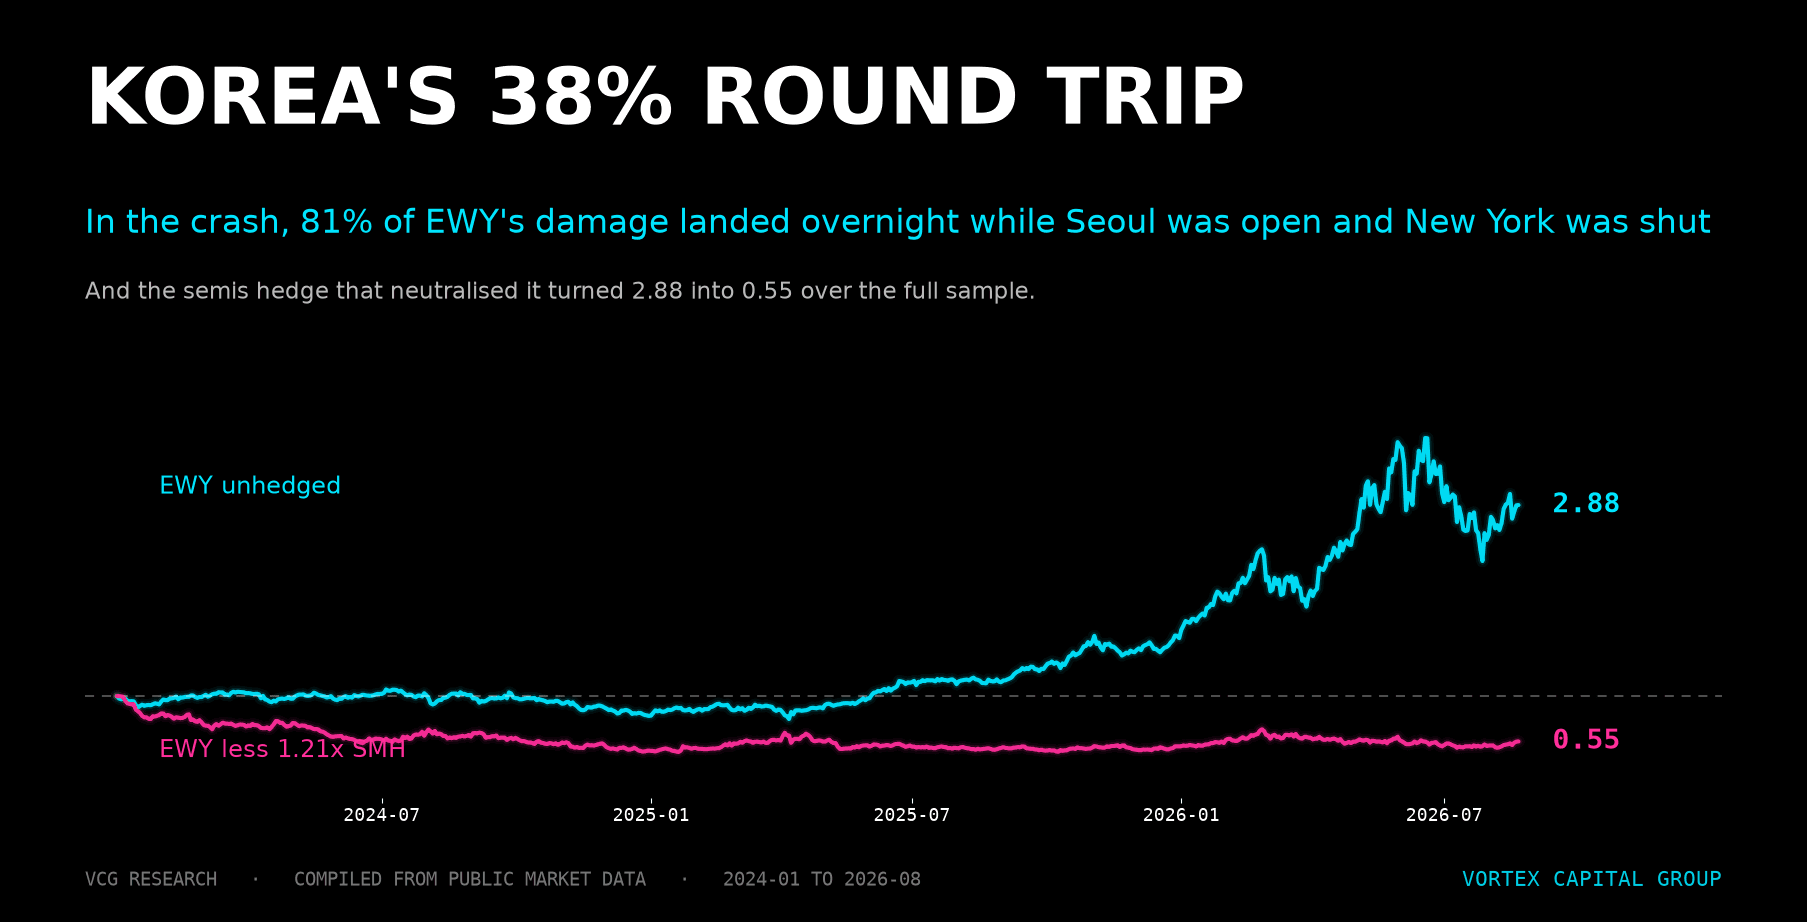
Korea's 38% Round Trip: What EWY Actually Is When Seoul Is Closed
KOSPI ran +241% into June 2026, then gave back 38.6% in five weeks. From the US side the instrument is EWY - and EWY is two different things depending on the clock. In the crash, 81% of the damage landed overnight while Seoul was open. The semis hedge that neutralised it turned 2.88 into 0.55 over the full sample.
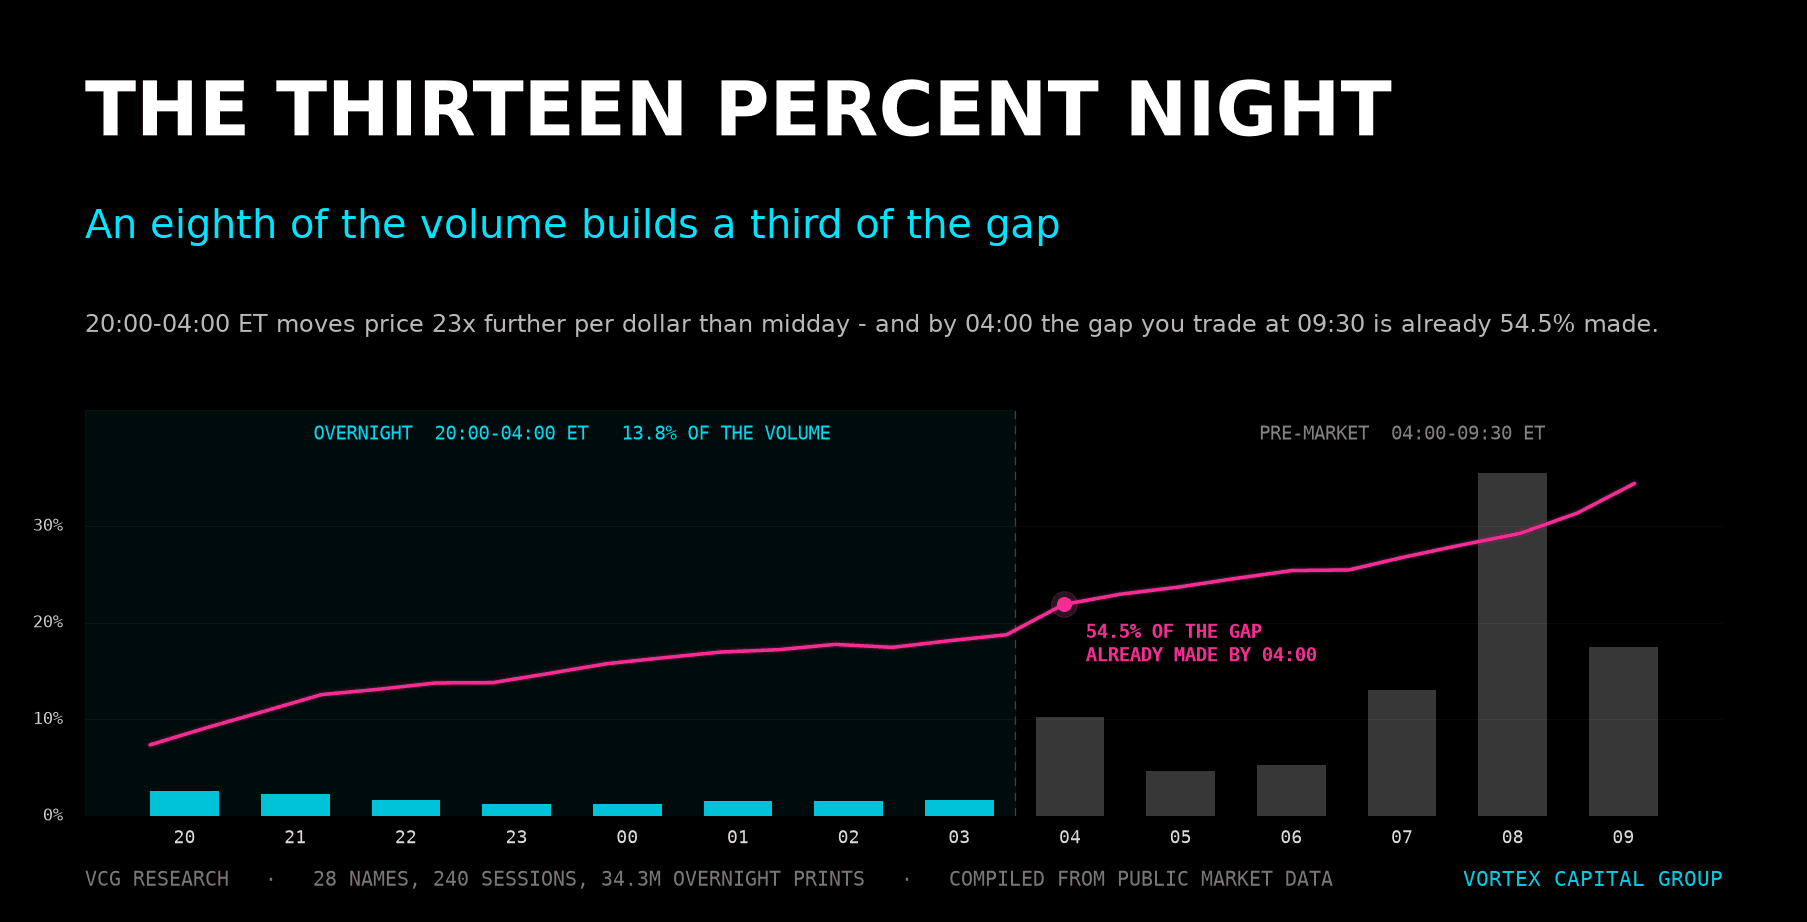
Thirteen Percent of the Volume, a Third of the Gap: What the Overnight Tape Is Worth at 04:00 ET
The 20:00-04:00 ET session now carries real single-name flow, and almost nobody charts it. Across 34.3 million overnight prints in 28 US names over 240 sessions it moves the price 23 times further per dollar than midday, and it builds a third of the gap you trade at 09:30. Fourteen ways of trading its direction all came back flat - including one that looked like a 113 bp discovery until we found our own look-ahead. What survives is a range forecast you can act on five and a half hours before the bell.
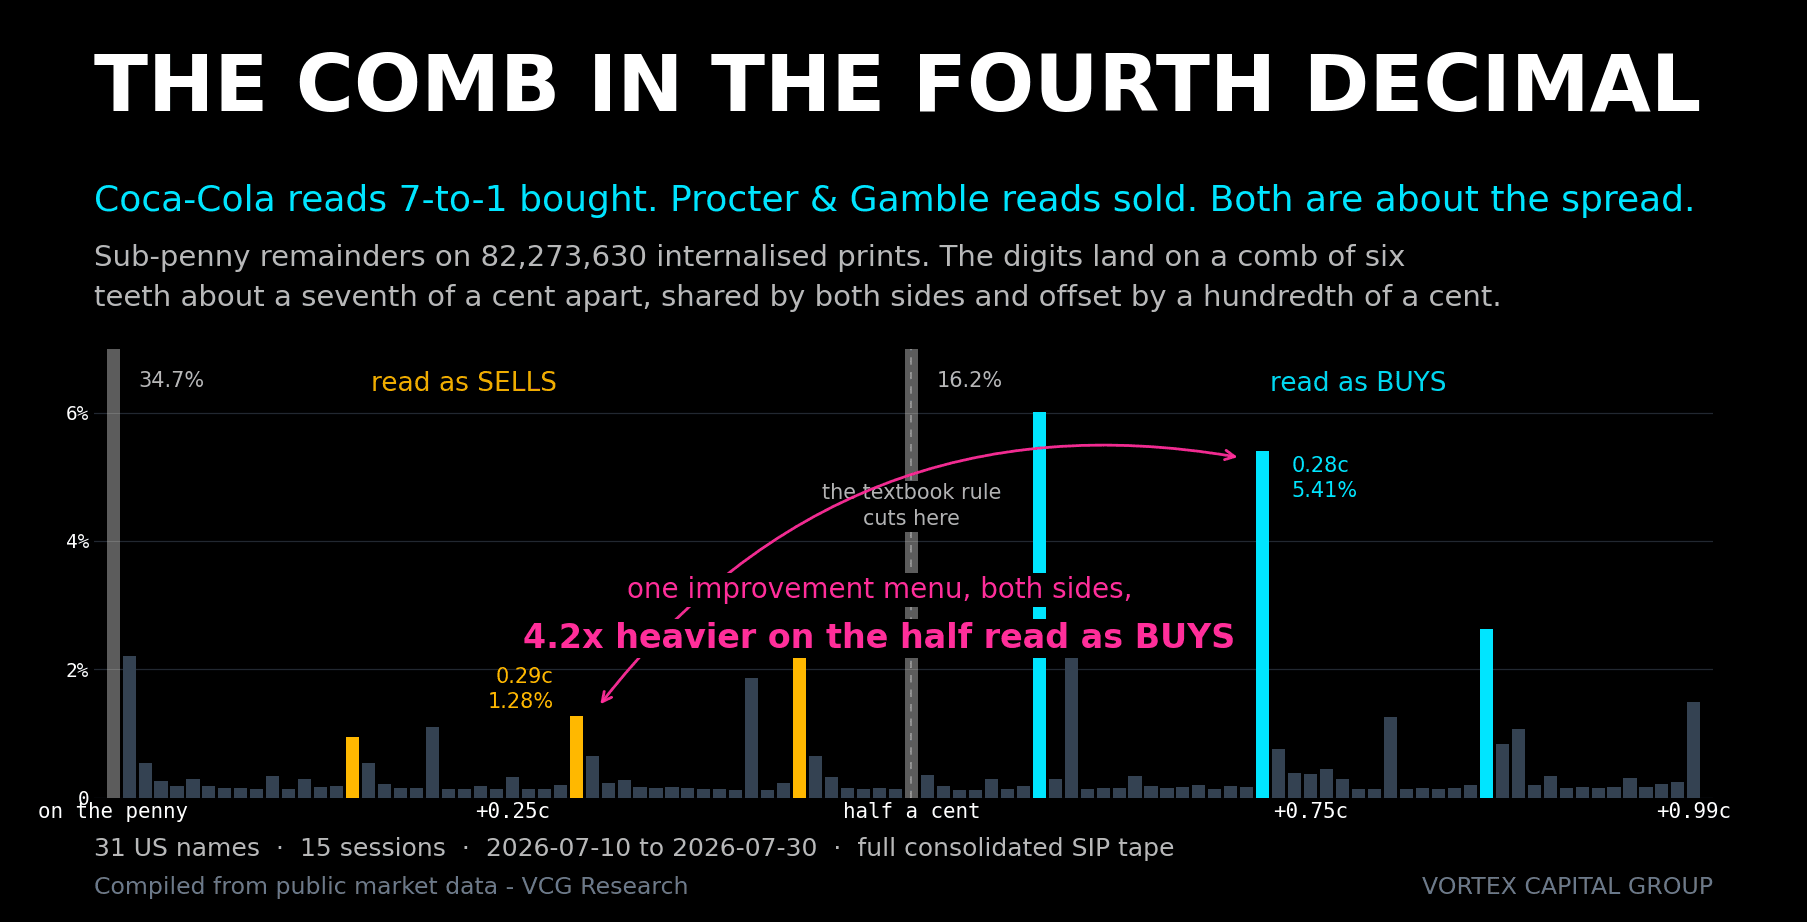
The Comb in the Fourth Decimal: What 157 Million Internalised Prints Actually Encode
Every internalised trade prints at a sub-penny price, and the standard method reads the customer's side out of those digits. Across 157.5 million prints those digits turn out to sit on a six-tooth comb about a seventh of a cent apart, shared by both sides of the market and offset by exactly one hundredth of a cent. The imbalance you compute from it ranges from 0.62x to 6.99x across names and tracks each stock's quoted spread - and the trade built on it returned t = 3.20 over seven sessions and t = -0.03 over the next eight.
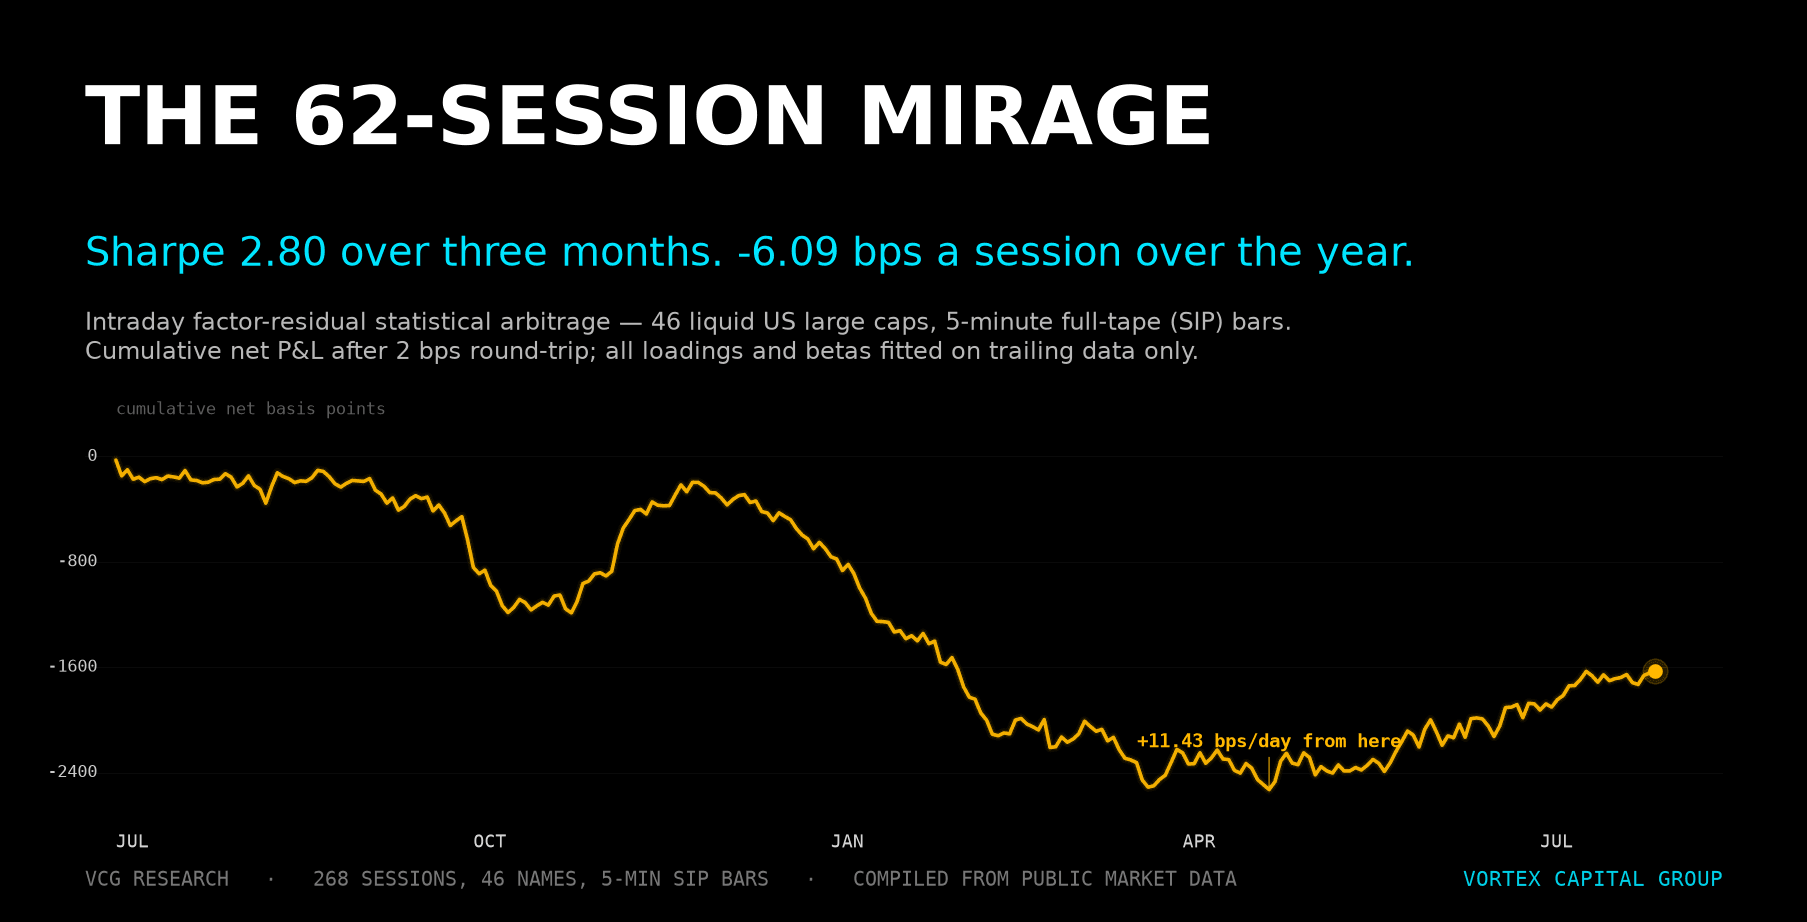
The 62-Session Mirage: The Sharpe 2.8 Strategy That Was Never There
We ran a full quant research program on intraday statistical arbitrage - PCA eigenportfolios, 46 large caps, full-tape data, strict trailing estimation. Three months in, it printed +11.43 bps a session at Sharpe 2.80. The full year returned -6.09. This is the post-mortem: five specific mechanisms that manufactured an edge out of nothing, each one measured - ending with the one result that cleared every test we had, until we gave it 10.5 years of history and it reversed sign.
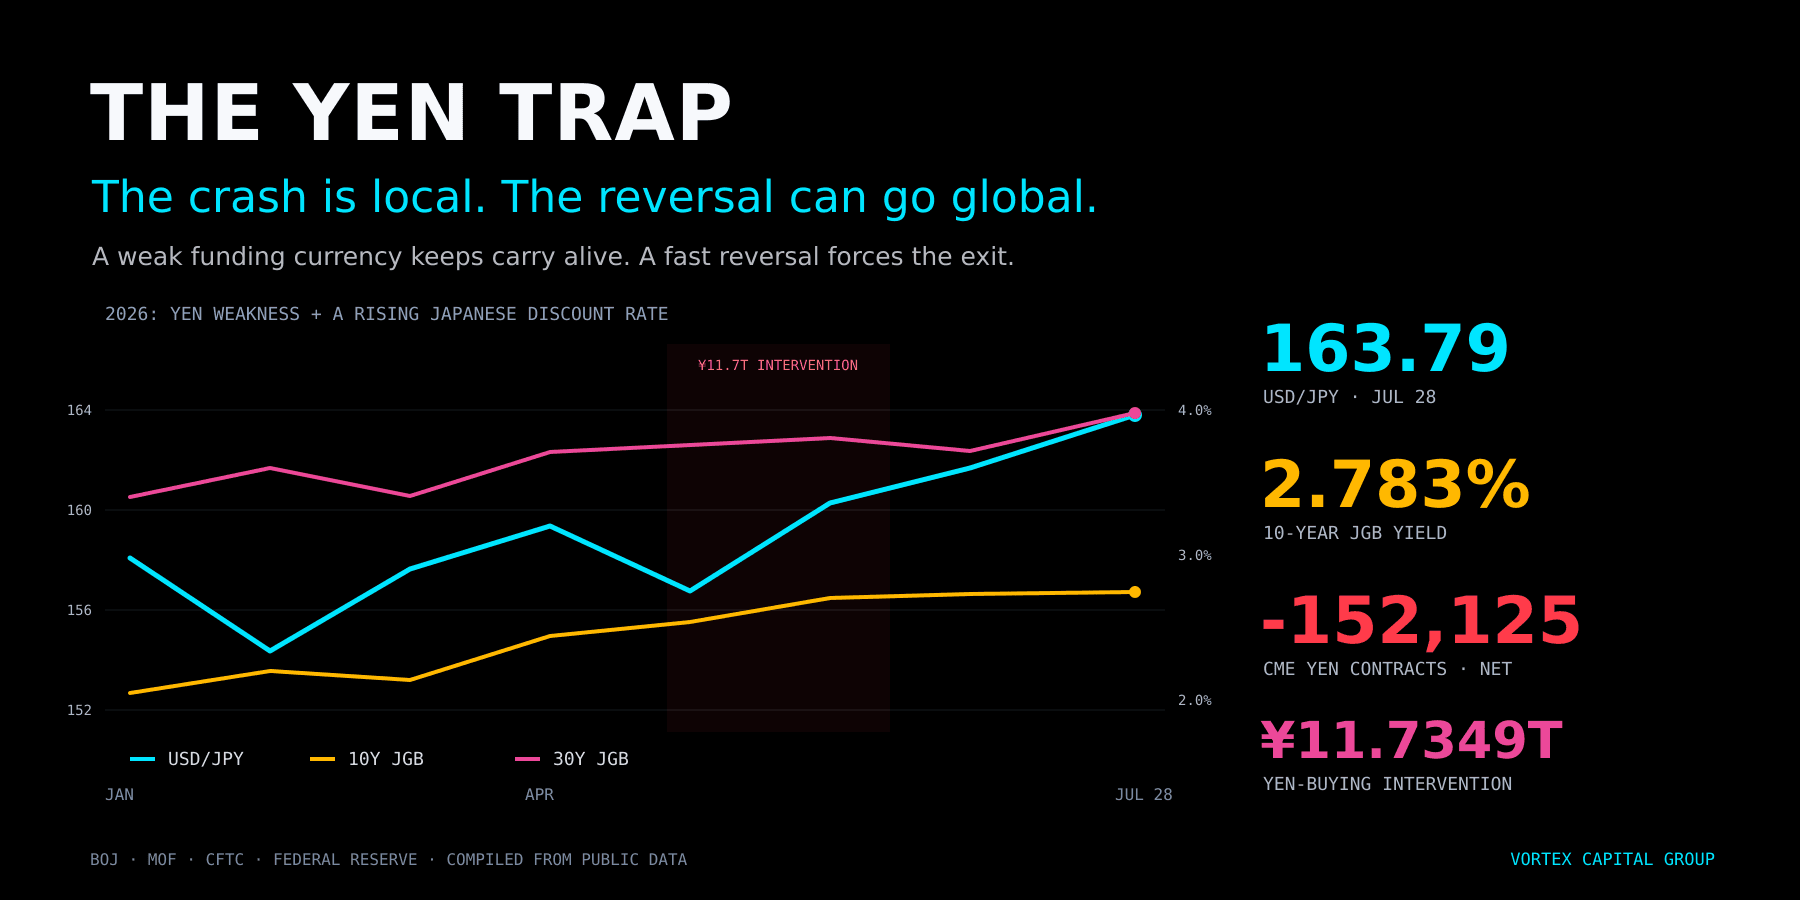
The Yen Trap: The Crash Is Local. The Reversal Can Go Global.
USD/JPY is 163.79, the BOJ policy rate is 1.0%, and speculators are net short 152,125 CME yen contracts. The weak yen is Japan's inflation problem. The market-wide risk is what happens if the funding currency snaps back before leveraged books can get out.
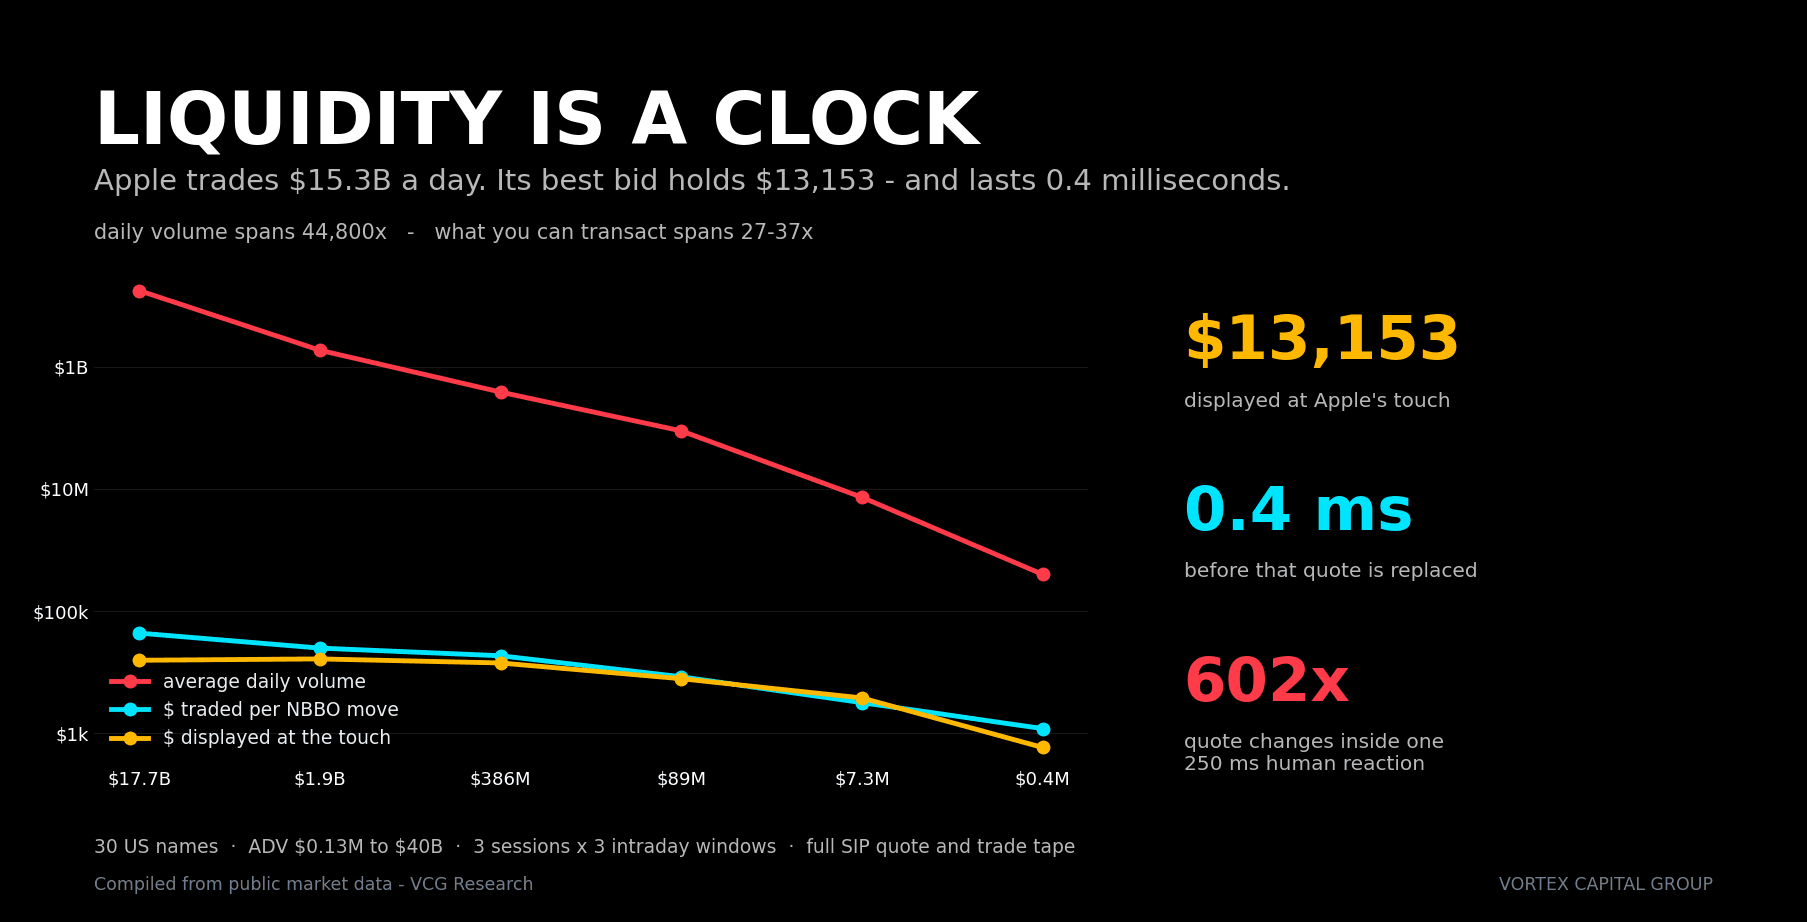
Liquidity Is a Clock, Not a Number: The $13,000 Bid in Apple
Apple trades $15.3 billion a day. At any given instant the best bid holds about $13,000 - and it lasts 0.4 milliseconds. We measured the full quote and trade tape for 30 US names across three sessions. Daily volume spans 44,800x across that range; what you can actually transact spans only 27-37x. The missing factor of roughly 1,200 is not size. It is refresh velocity - and it means ADV has been measuring the wrong thing.
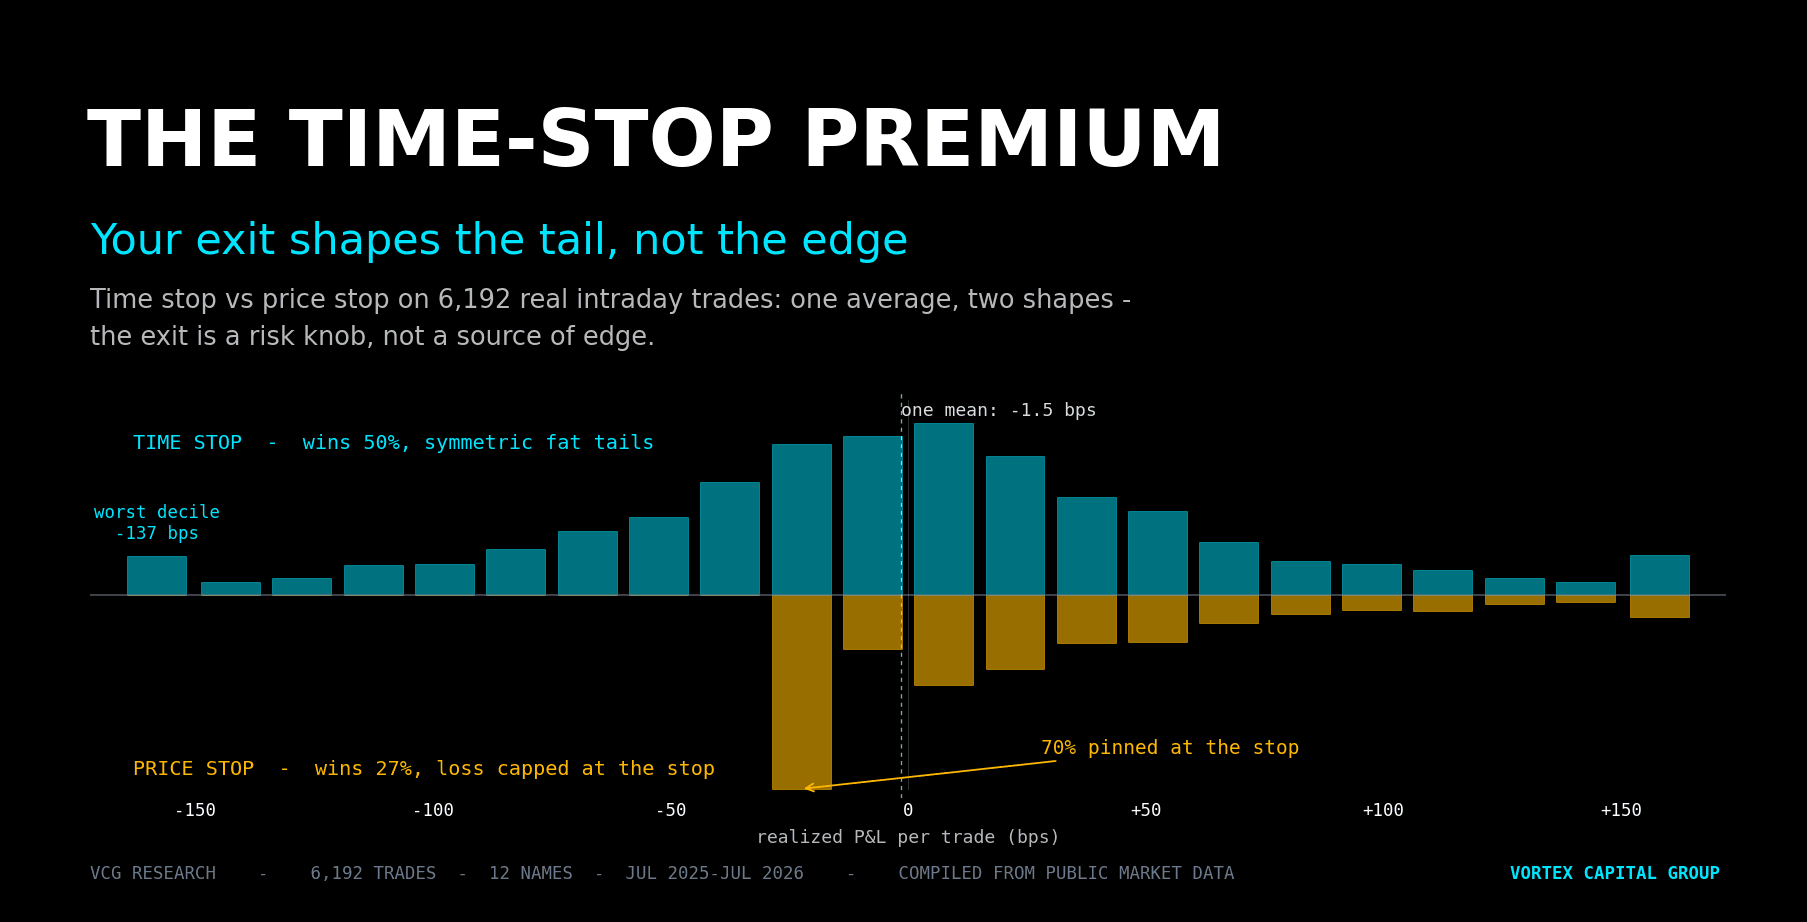
The Time-Stop Premium: Your Exit Shapes the Tail, Not the Edge
Traders argue endlessly about the exit - cut it fast with a tight price stop, or give it room and let a time stop ride the noise out. We put 6,192 real intraday trades through both. The 'premium' everyone fights over is under a basis point and changes sign; a 20 bps price stop and a pure time stop finish within 0.3 bps of the same average. What the exit does change is enormous: the price stop pins 70% of trades onto a capped -22 bps loss, the time stop leaves a symmetric tail six times wider. The exit is a risk knob, not an alpha knob - and a tight stop shakes you out of 46% of your own winners.
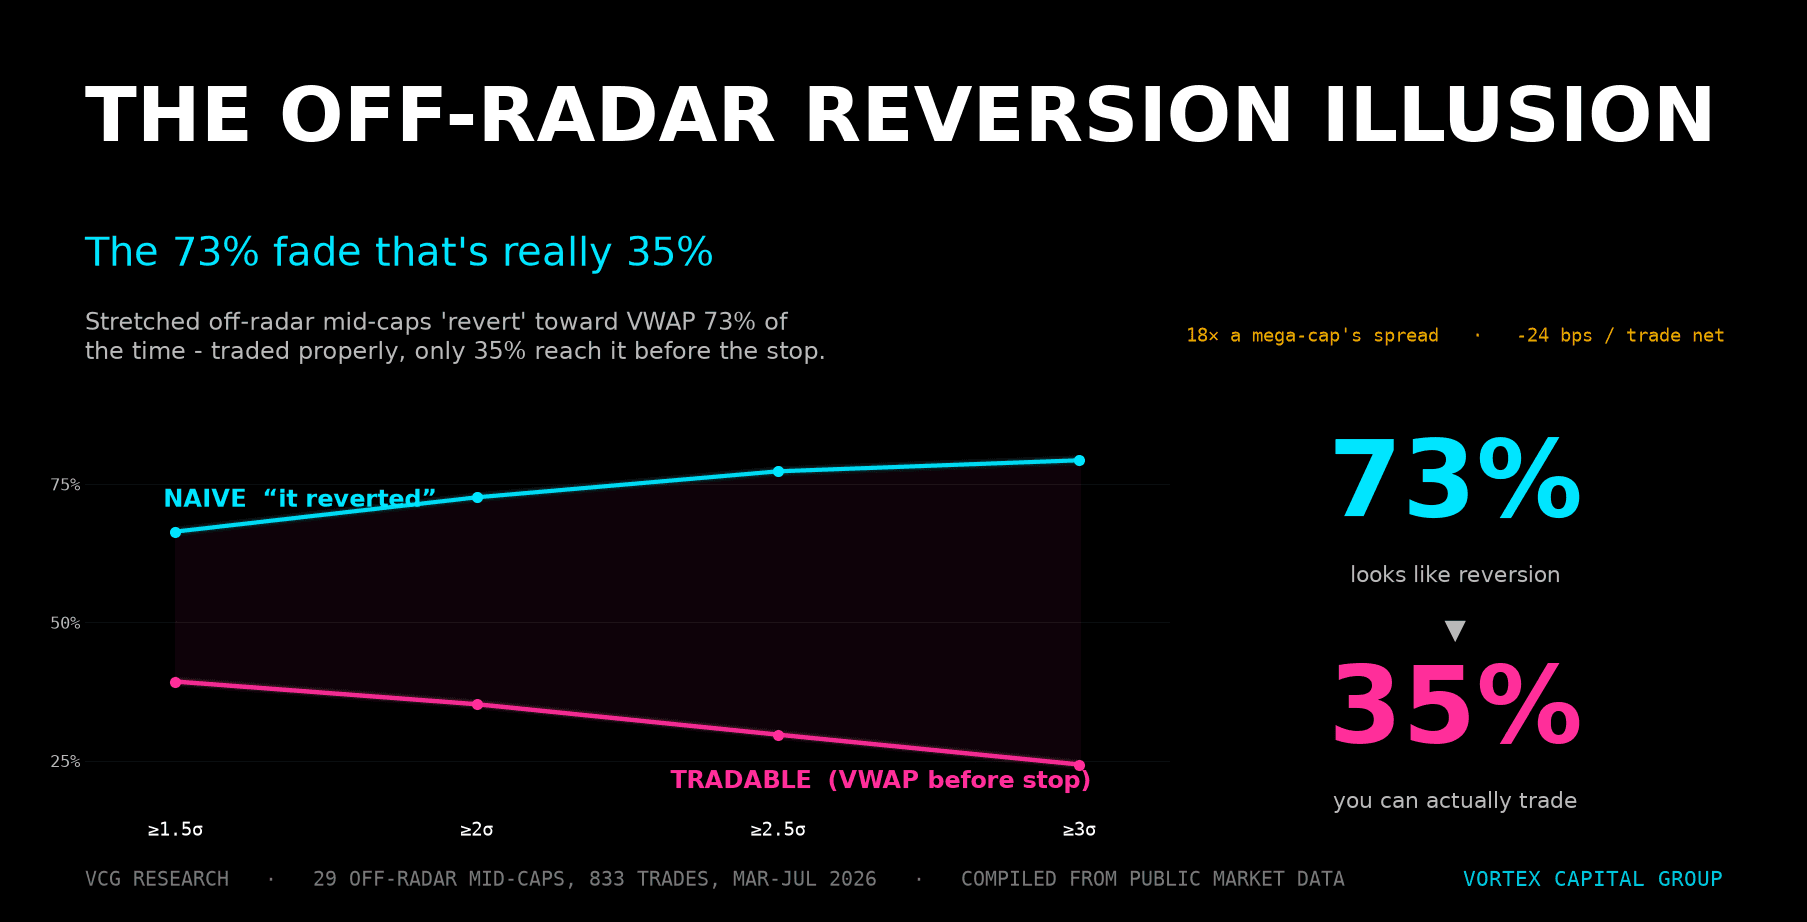
The Off-Radar Reversion Illusion: The 73% Fade That's Really 35%
Overextended mid-caps that nobody watches look like a fader's paradise - stretched far from VWAP, they 'revert' 73% of the time. We measured 29 off-radar names against the crowded mega-caps: traded properly, only 35% actually reach VWAP, the gross edge is a coin toss, and a spread 18× wider than a mega-cap's turns it into -24 bps a trade. The wide range that looks like opportunity and the wide spread that eats it are the same thing.
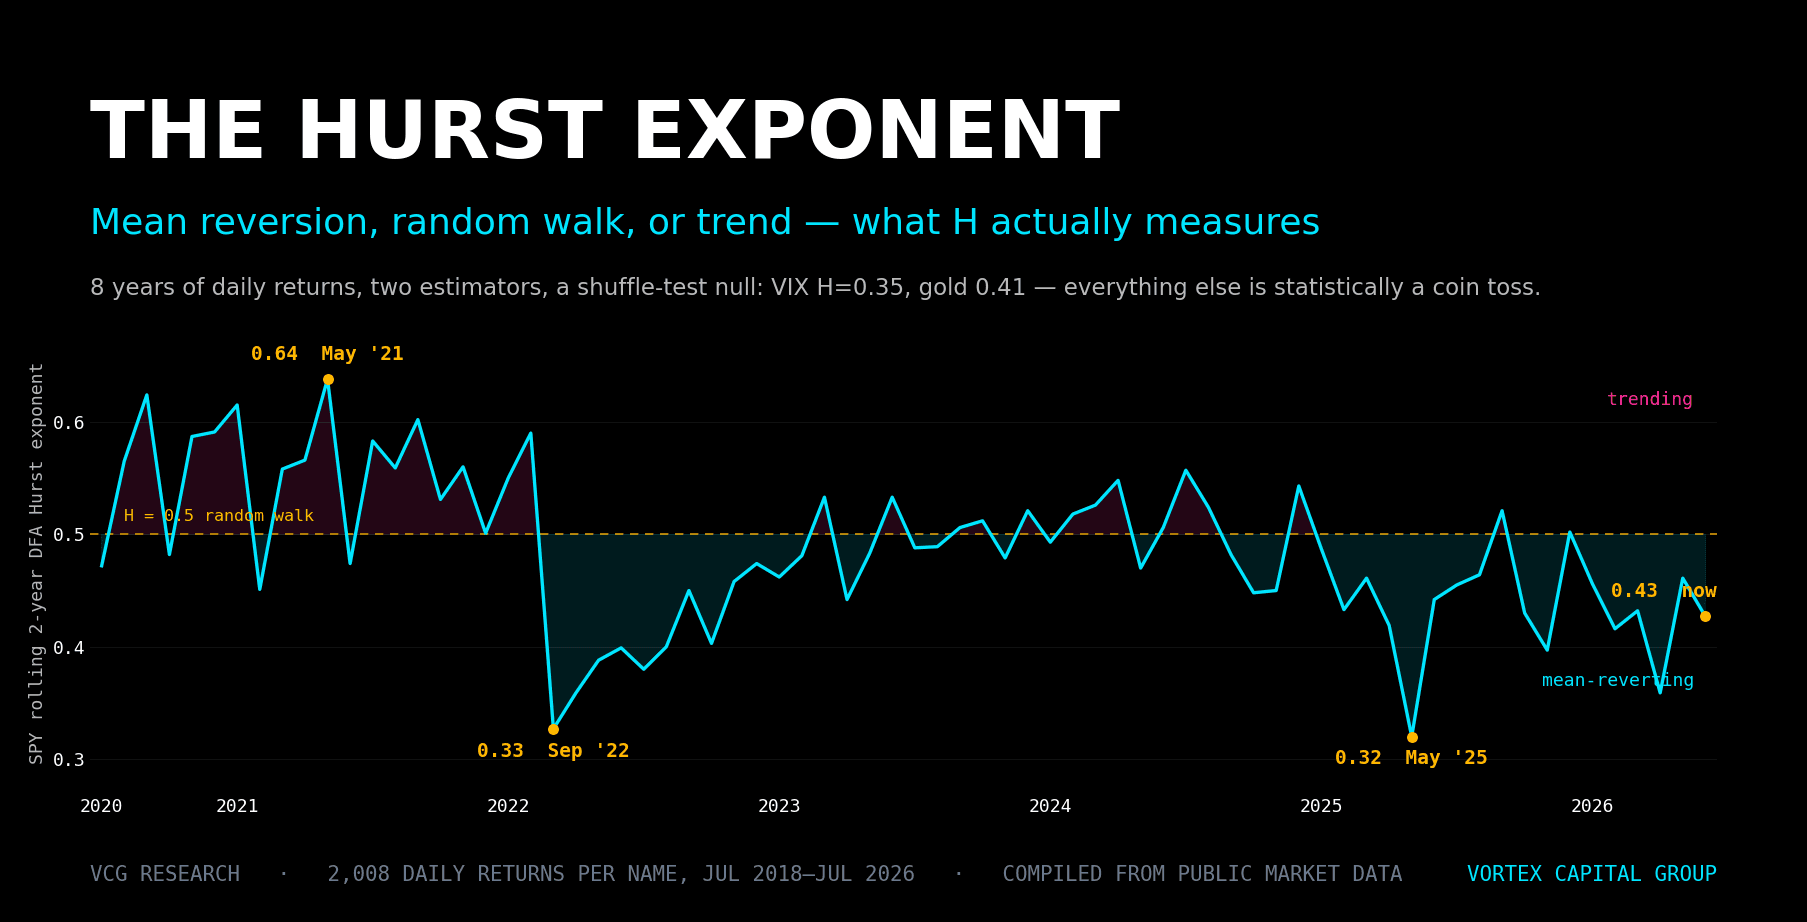
The Hurst Exponent: Mean Reversion, Random Walk, or Trend - What H Actually Measures
We computed H two ways on 8 years of daily returns for 7 instruments. VIX prints 0.35 and gold 0.41 - genuinely mean-reverting. Everything else is statistically a random walk, and the popular R/S estimator runs ~0.10 too hot.
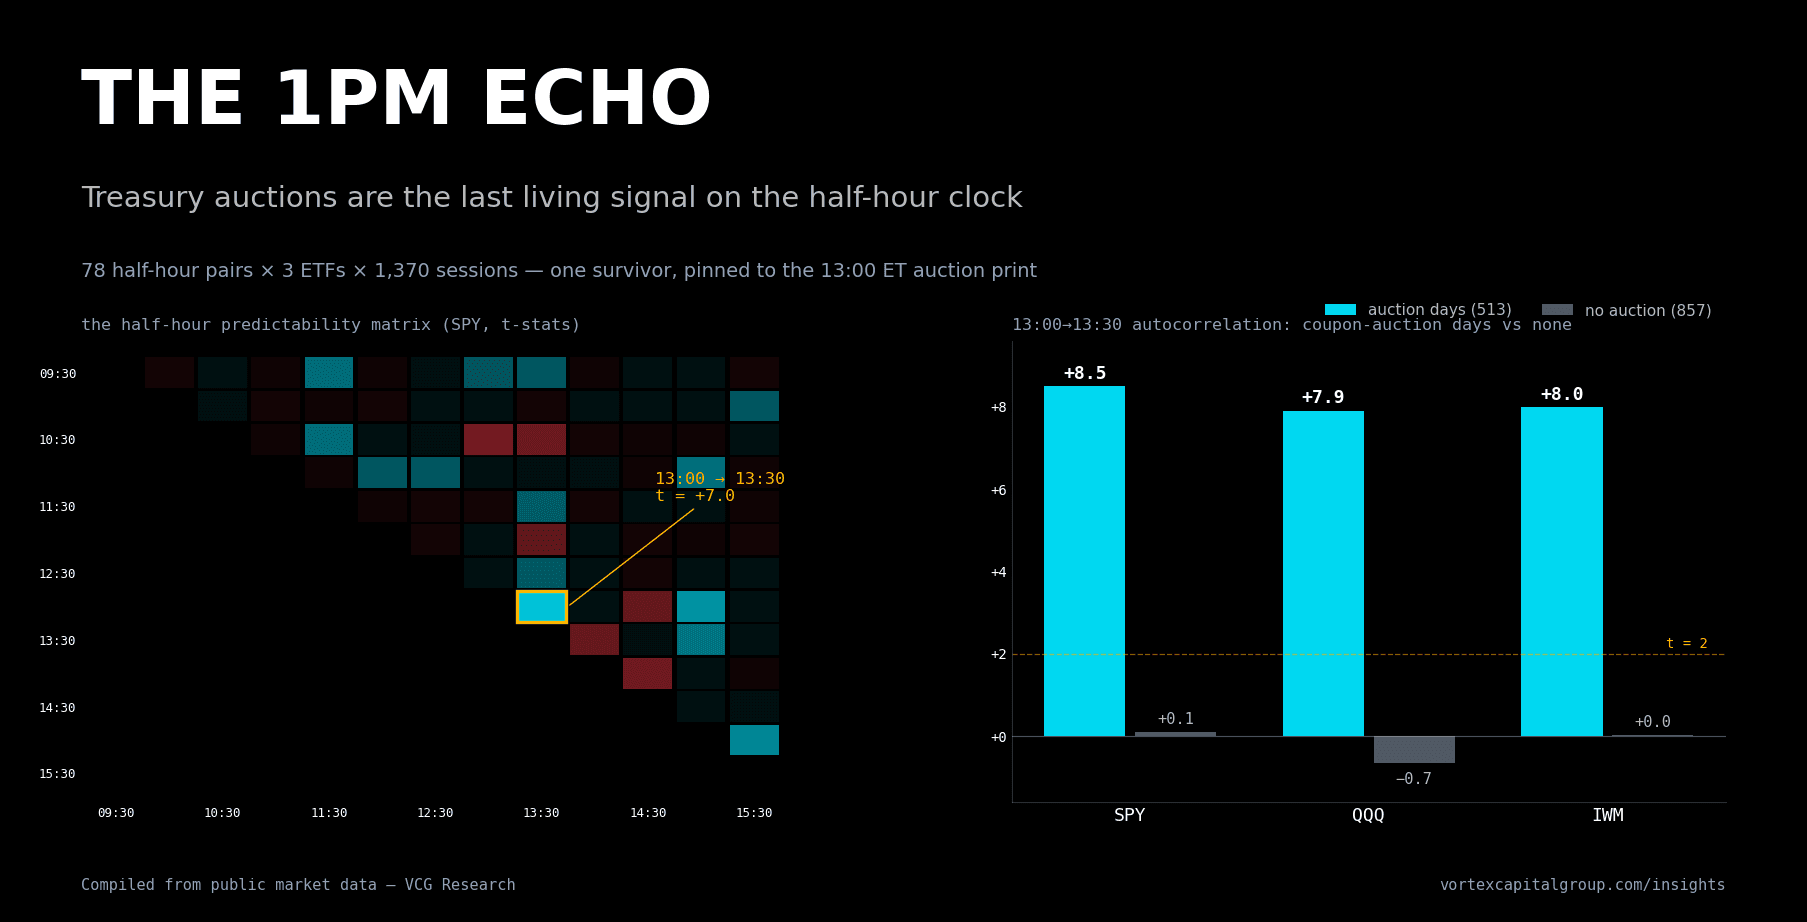
The 1PM Echo: Treasury Auctions Are the Last Living Signal on the Half-Hour Clock
We tested all 78 half-hour pairs of the trading day across 1,370 sessions. Every famous intraday signal is dead or dying - except one, pinned to the Treasury's 1PM auction clock: t = +8.5 on auction days, zero without.
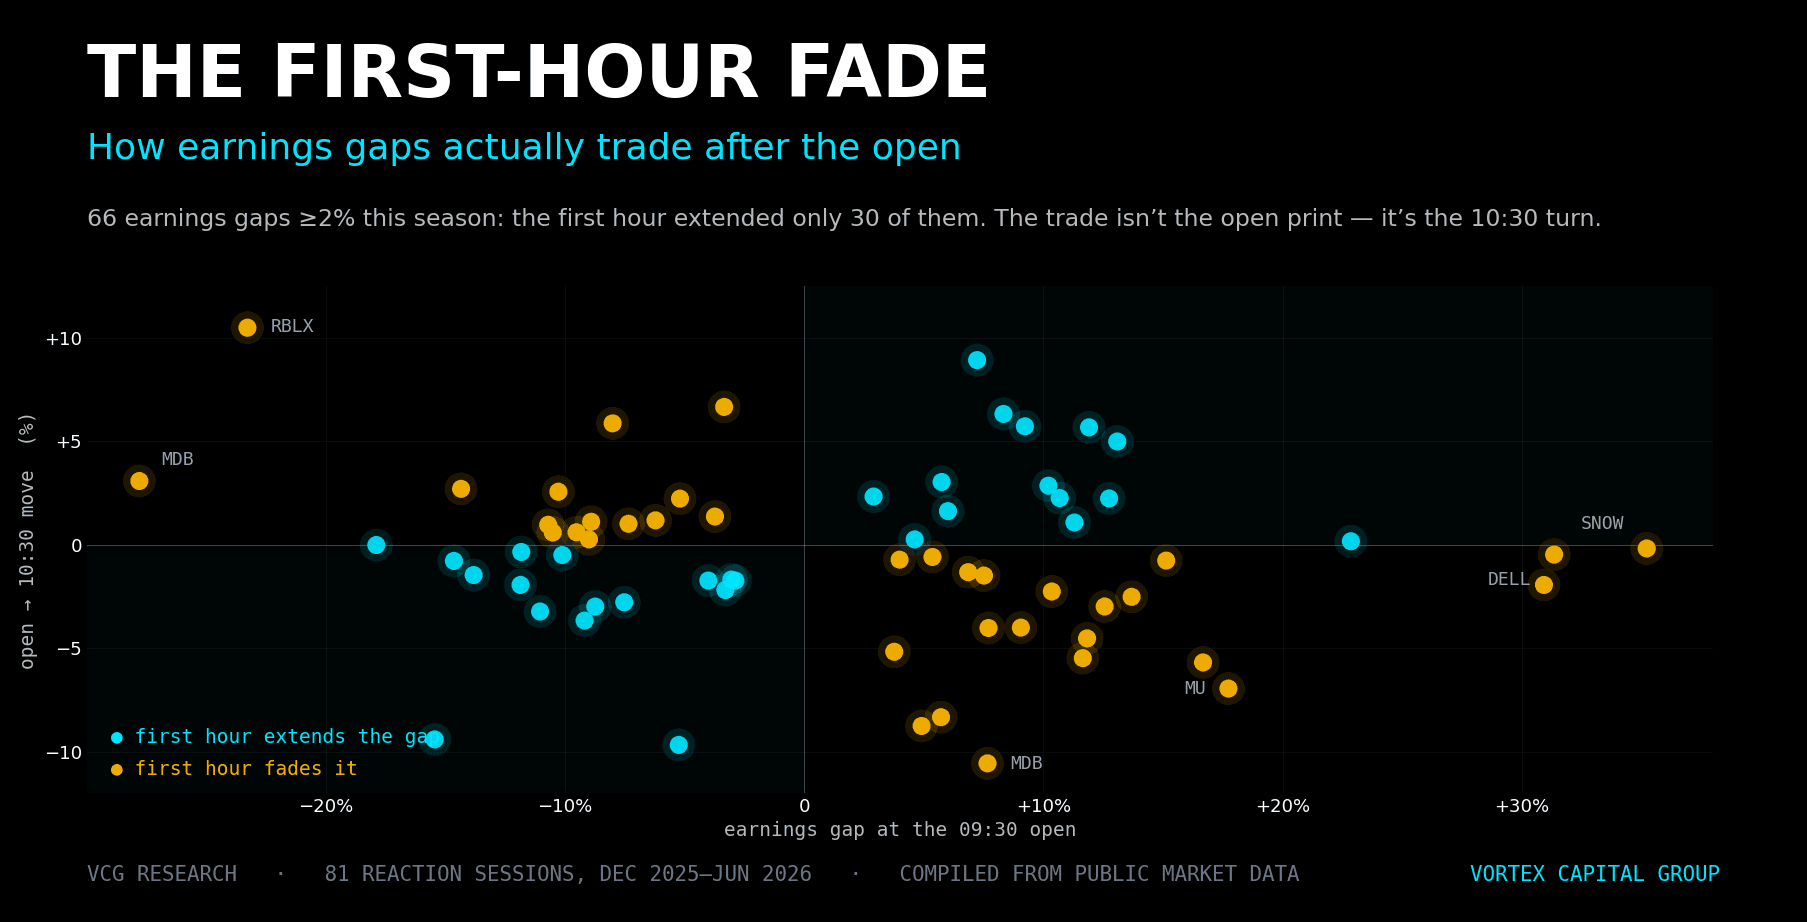
The First-Hour Fade: How Earnings Gaps Actually Trade After the Open
81 earnings reactions this cycle: the first hour extended the gap in just 30 of 66 gaps. The trade isn't the open print - it's the 10:30 turn, at 22:30 HKT.
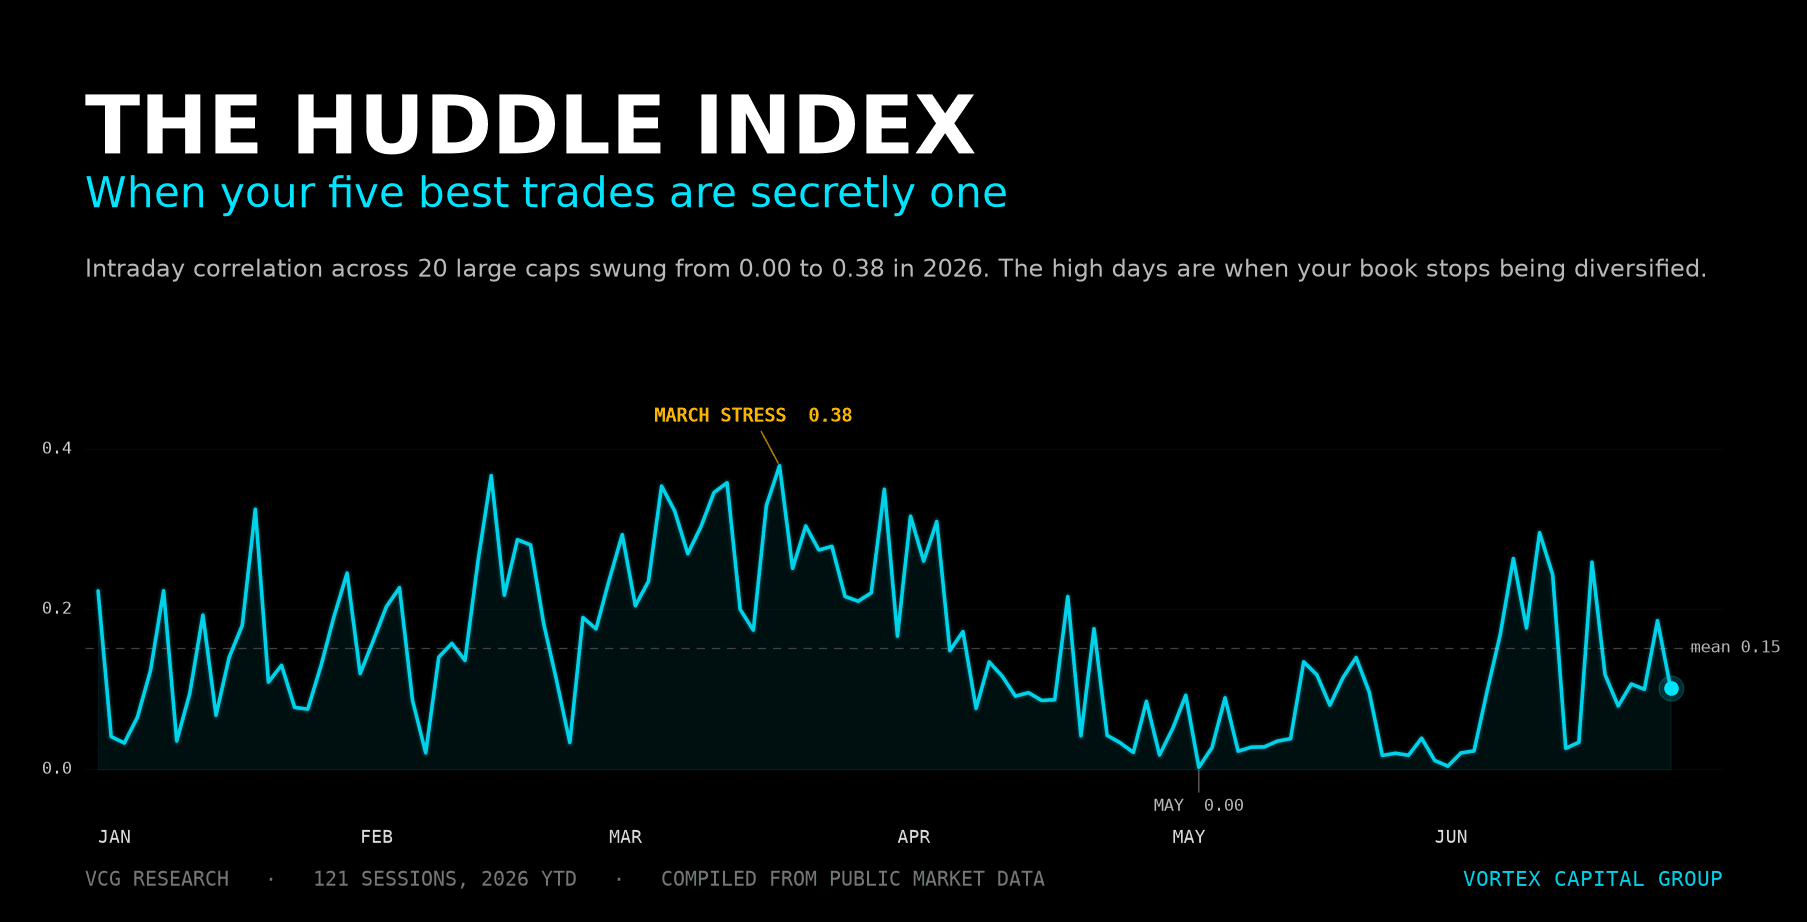
The Huddle Index: When Your Five Best Trades Are Secretly One
An intraday correlation gauge across 20 large caps for every 2026 session. It won't time the tape - it measures how many independent bets your book actually holds.
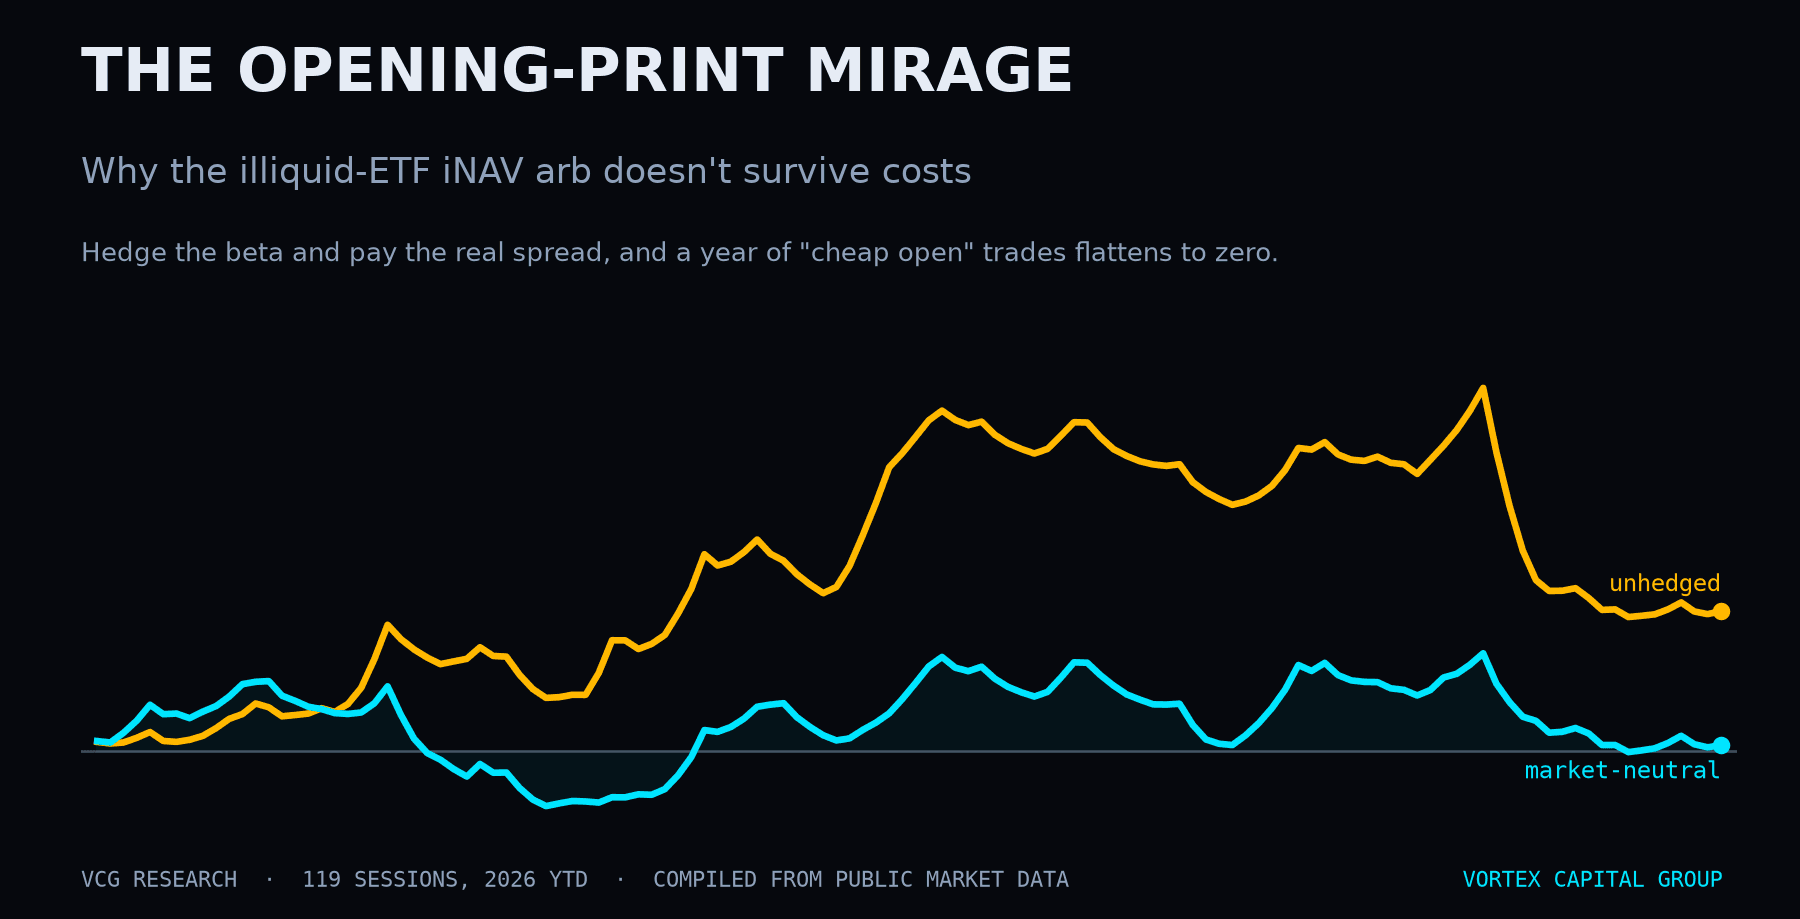
The Opening-Print Mirage: Why the Illiquid-ETF iNAV Arb Doesn't Survive Costs
We tested buying cheap ETF opens back to iNAV on 119 sessions of 2026 data. The dislocation is real - but net of beta and the real spread, the edge is zero.
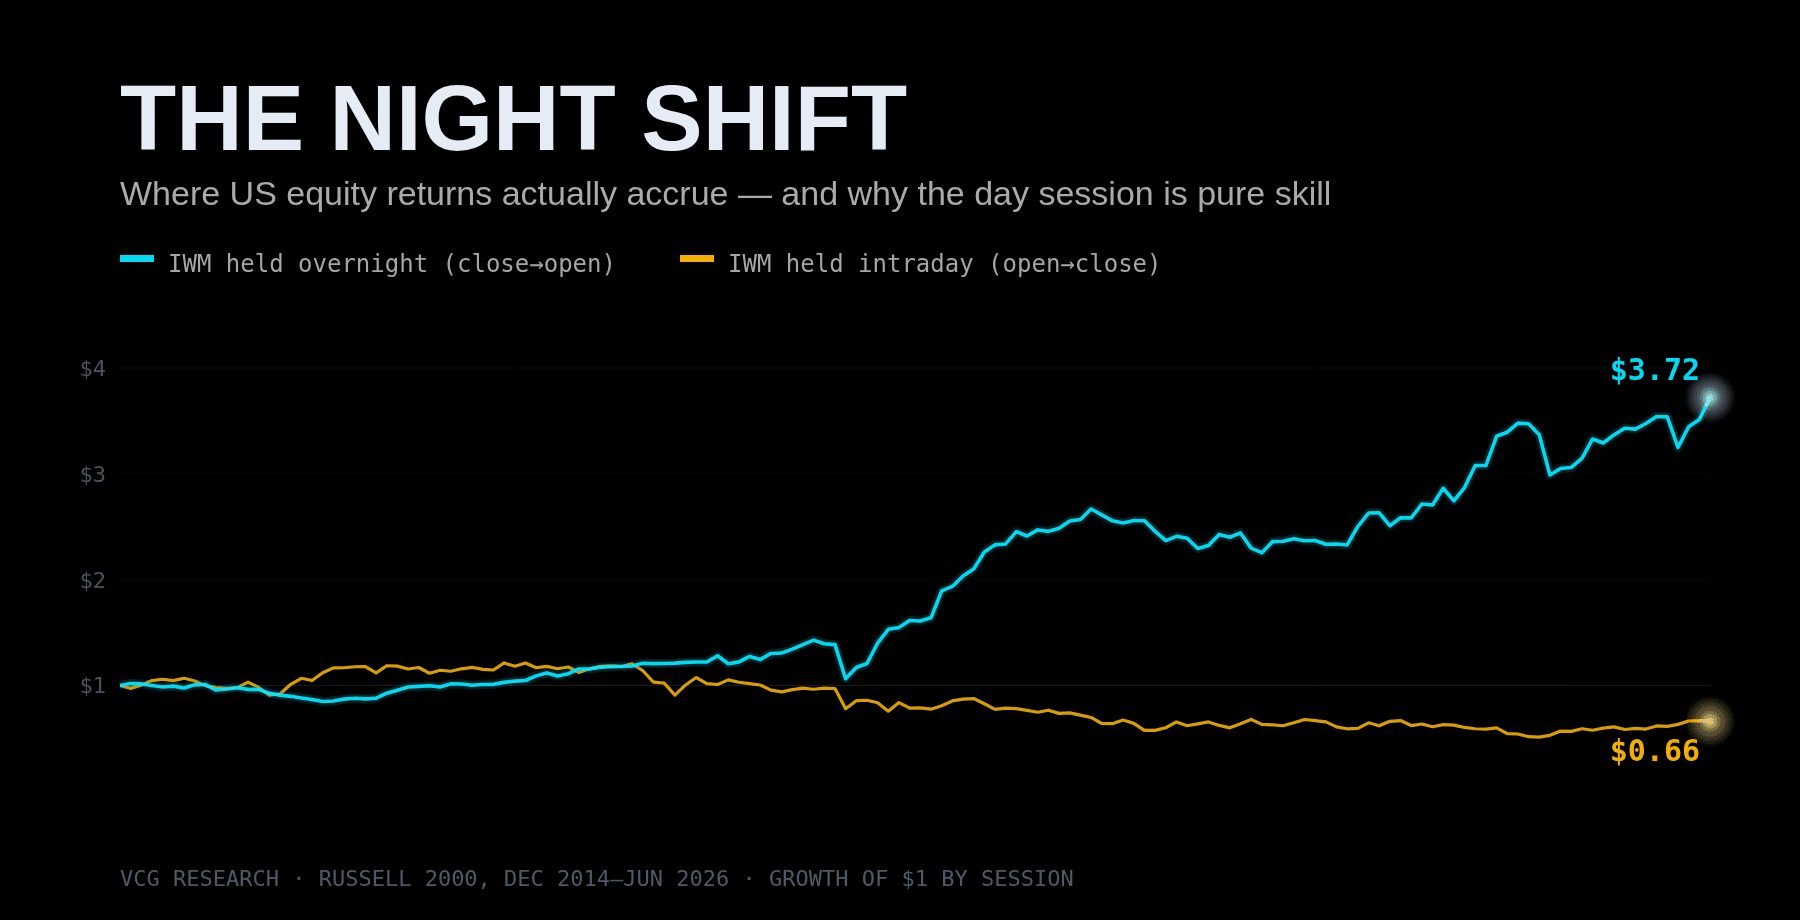
The Night Shift: Where US Equity Returns Actually Accrue - and Why the Day Session Is Pure Skill
A decade of SPY, QQQ, and IWM split into overnight and intraday sessions: almost all the drift accrues overnight. Intraday edge has to come from skill, not beta.
The SIP Lag: How a Stale Public Quote Becomes a Hidden Execution Tax
The consolidated tape (SIP) is structurally slower than direct feeds - by design. What the lag costs a fast trader, when it widens, and why your feed matters.
Risk-Off Equity Routing: How VIX Spikes Reprice SPY & QQQ
When VIX clears 28, SPY intraday range medians 2.2% - 3x calm-tape behaviour. A data-driven risk-off routing playbook for prop and proprietary traders.
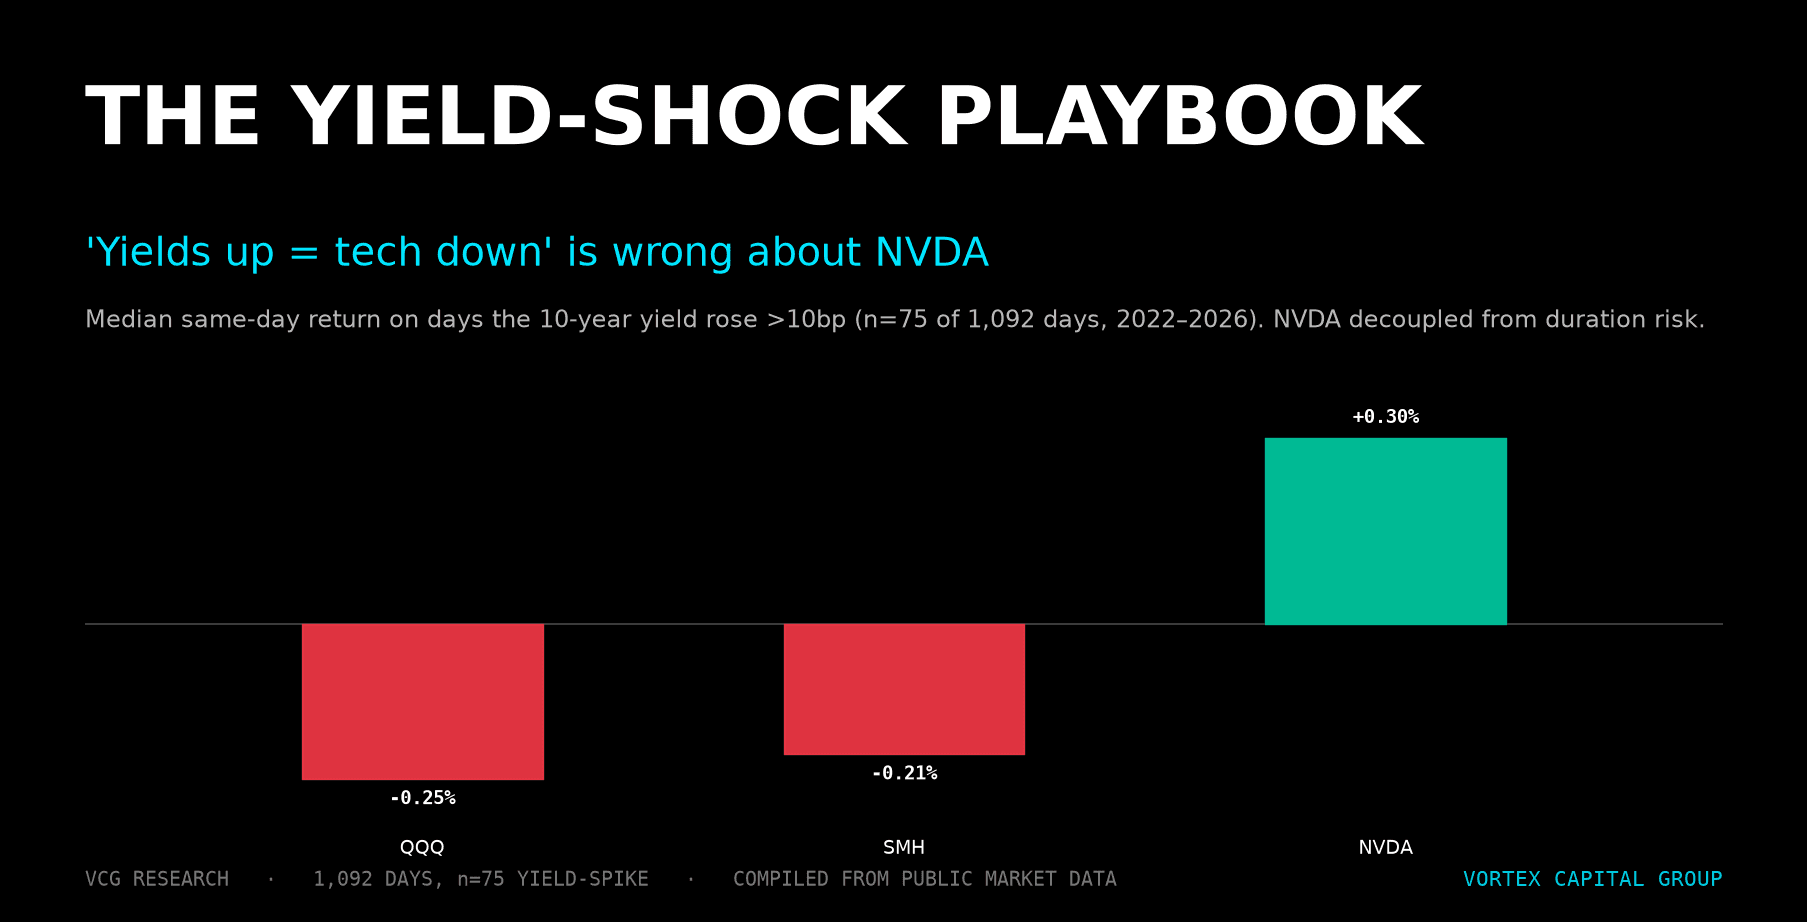
Yield Shock Playbook: QQQ, NVDA & SMH When Rates Move
The 'yields up = tech down' rule is wrong about NVDA. 1,092 sessions of data show NVDA decouples on big yield-up days. Sizing and routing framework inside.
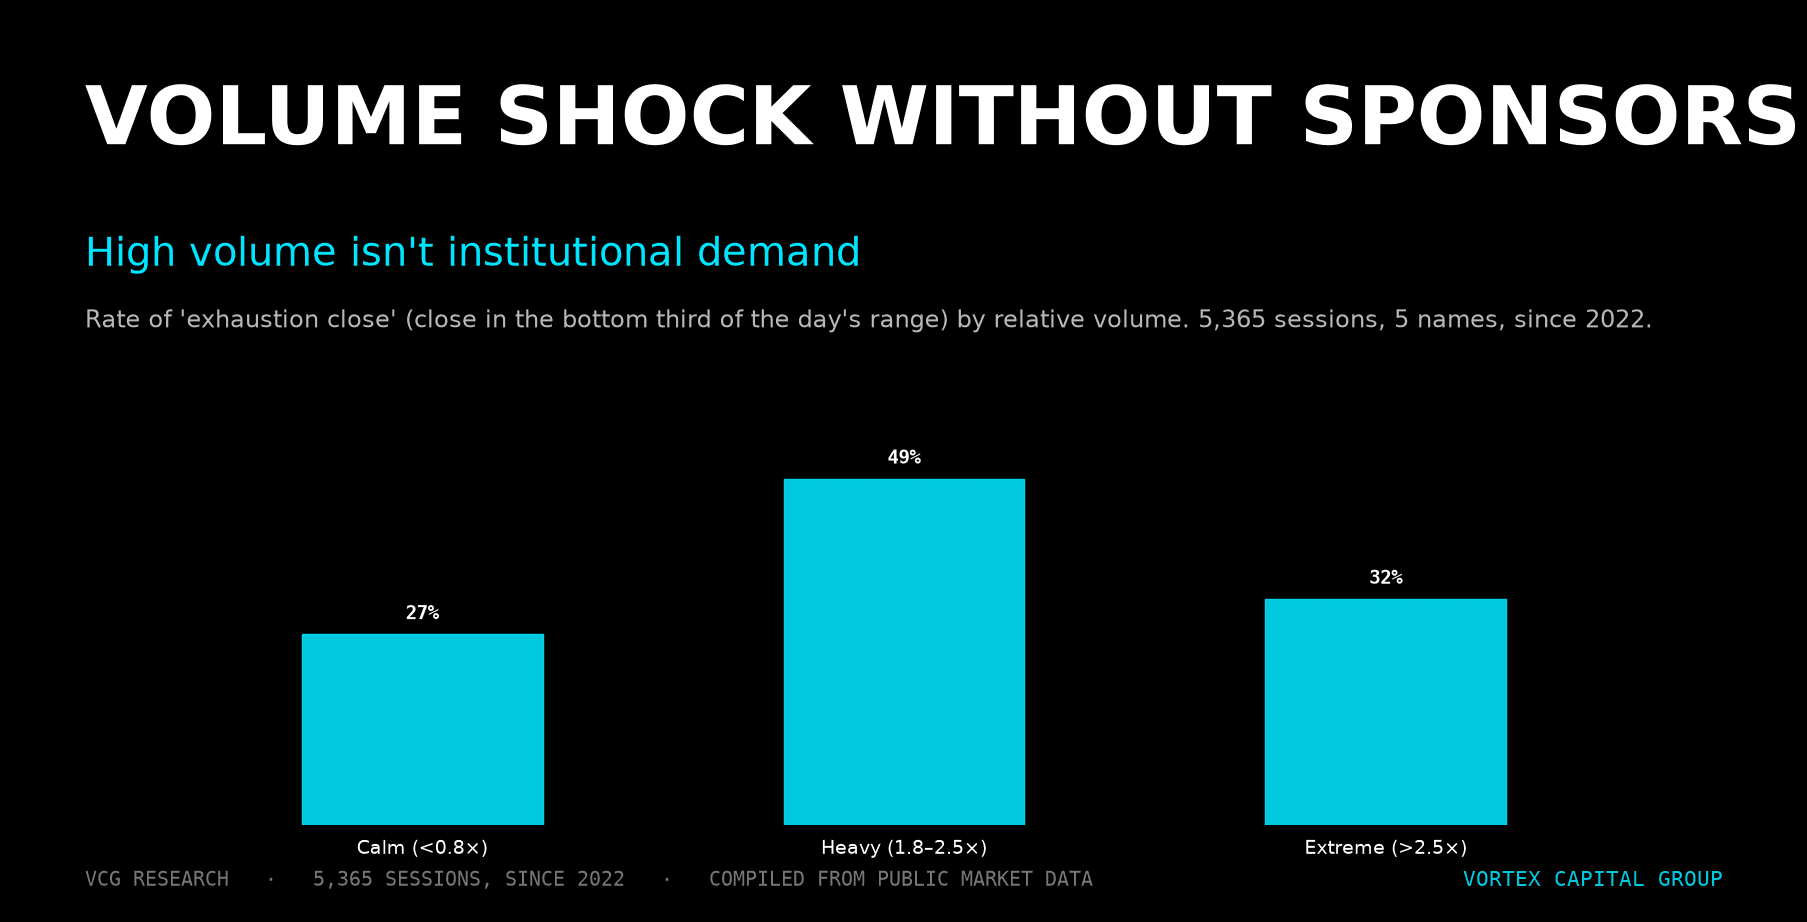
Volume Shock Without Sponsorship: The Exhaustion Edge
Across 5,365 sessions, high relative volume produced exhaustion closes 49% of the time. How prop traders separate participation from sponsorship in real time.
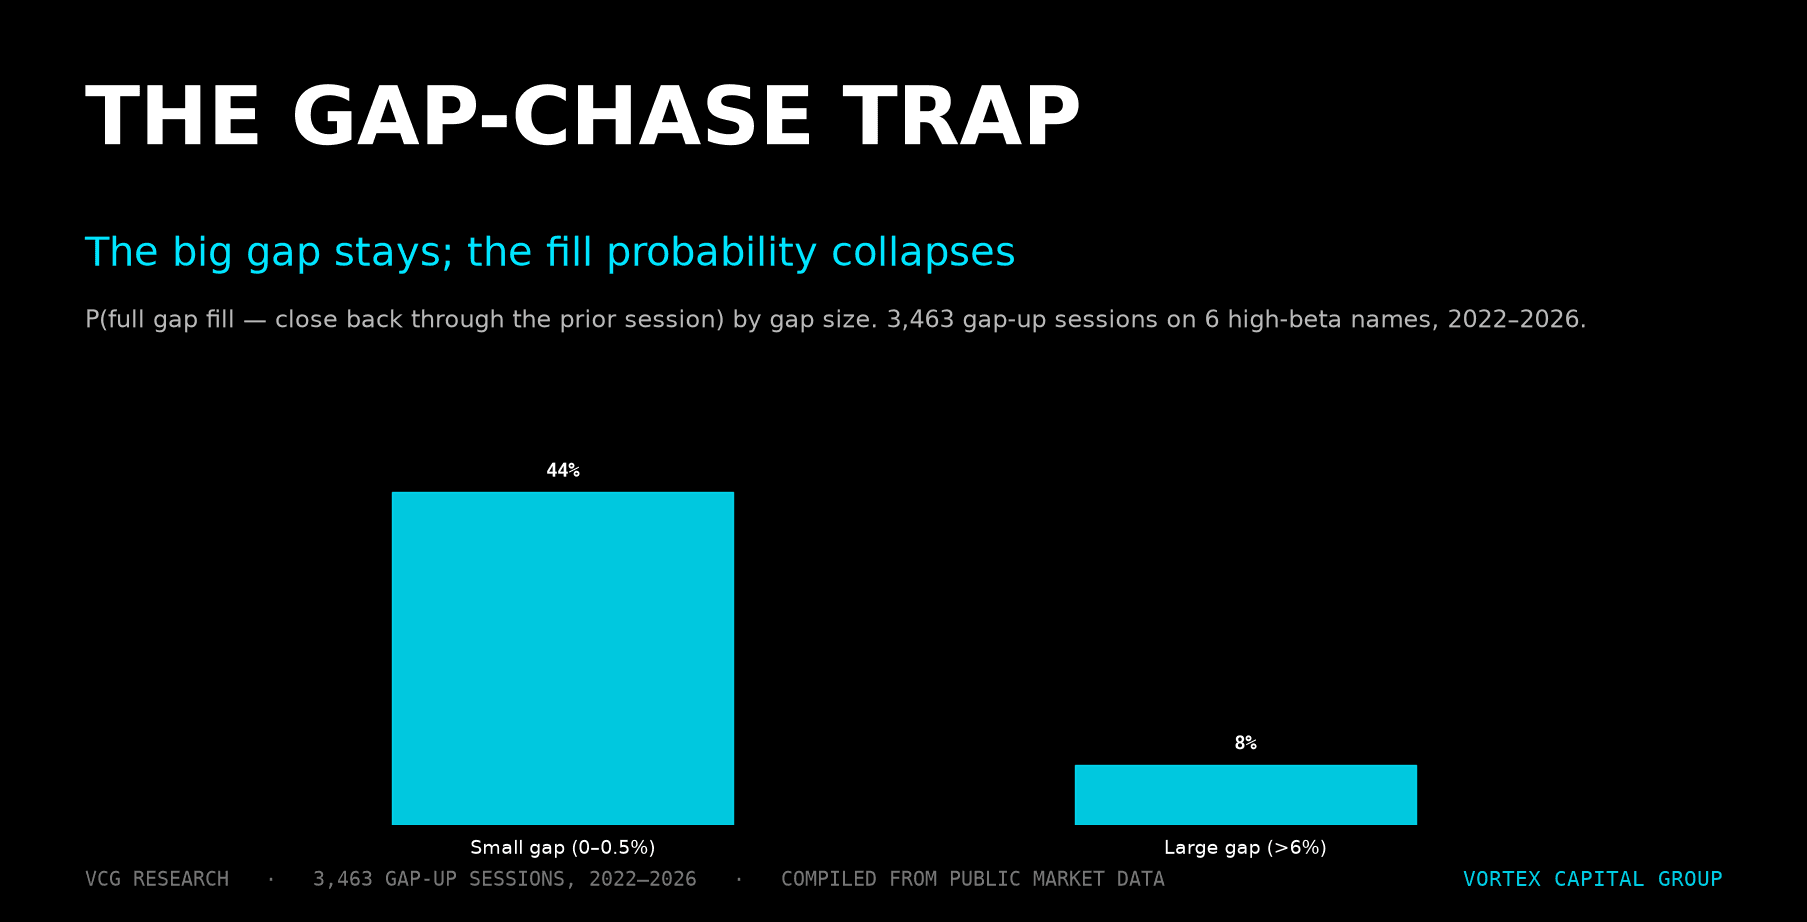
The Gap-Chase Trap: Why Strong US Equity Opens Fade
3,463 gap-up sessions on QQQ, NVDA, and TSLA: the intraday fade is 50% at every gap size, but the gap itself rarely fills above 2%. The trade is the cash session.
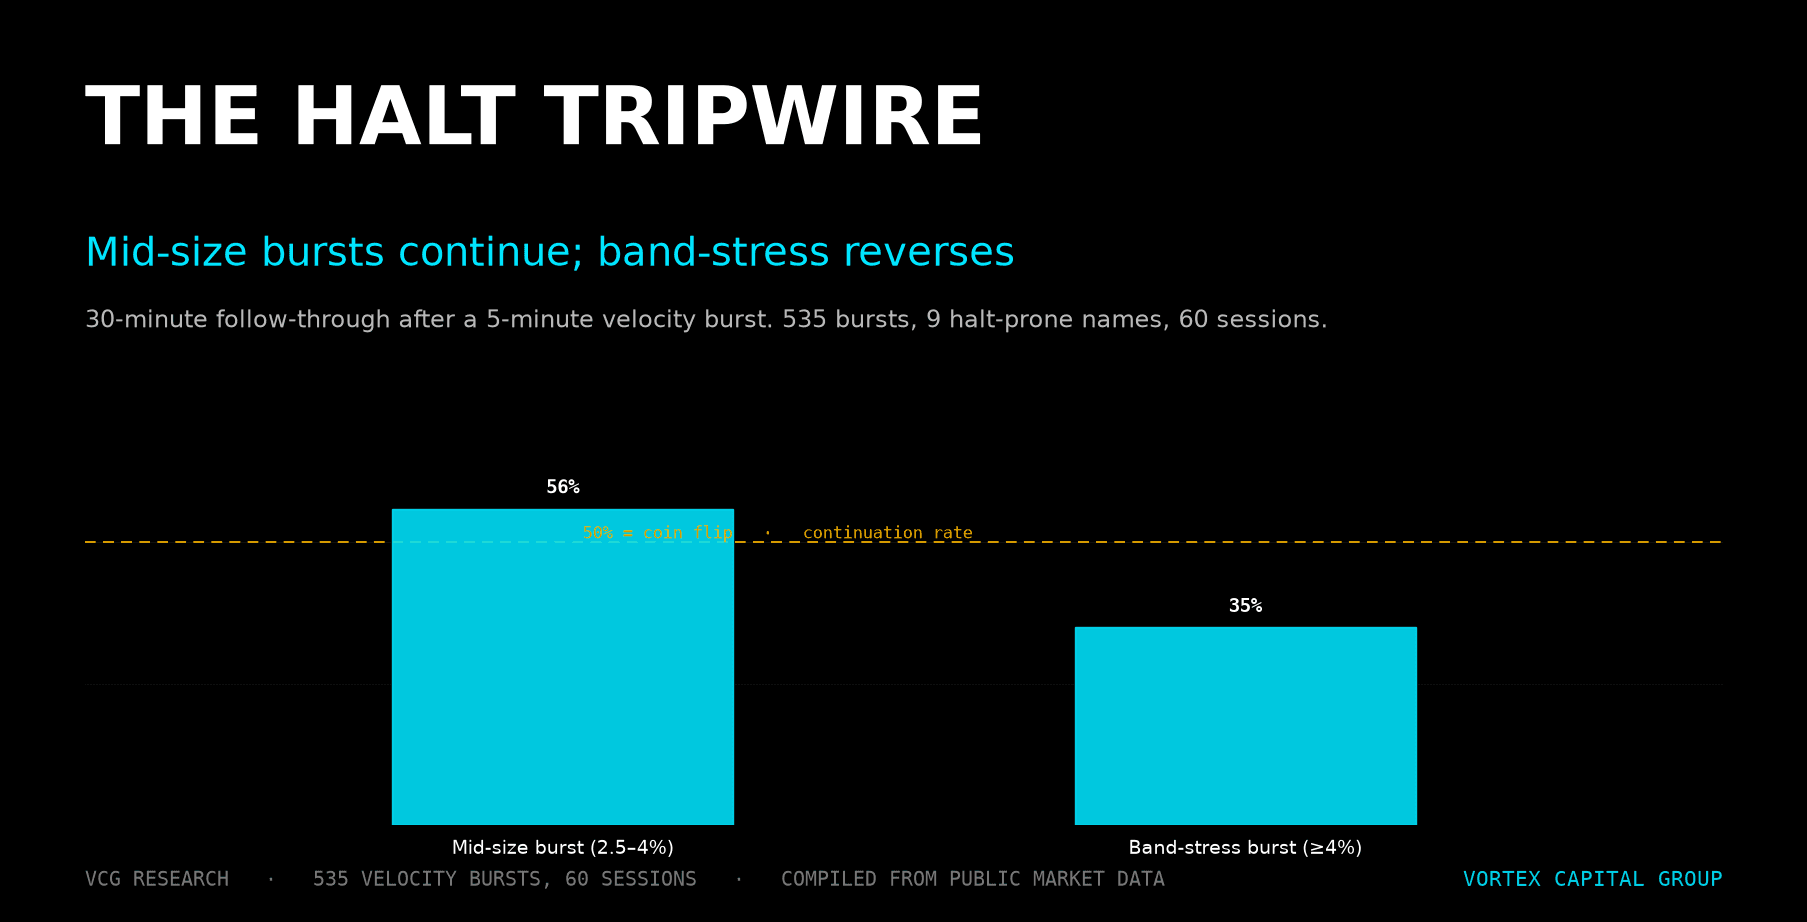
The Halt Tripwire: LULD Band Math, Velocity Bursts, and Trading the Reopen
535 velocity bursts across 9 halt-prone names: 2.5-4% bursts continue 56% of the time; band-stress bursts ≥4% reverse 65%. The LULD band is the wall.
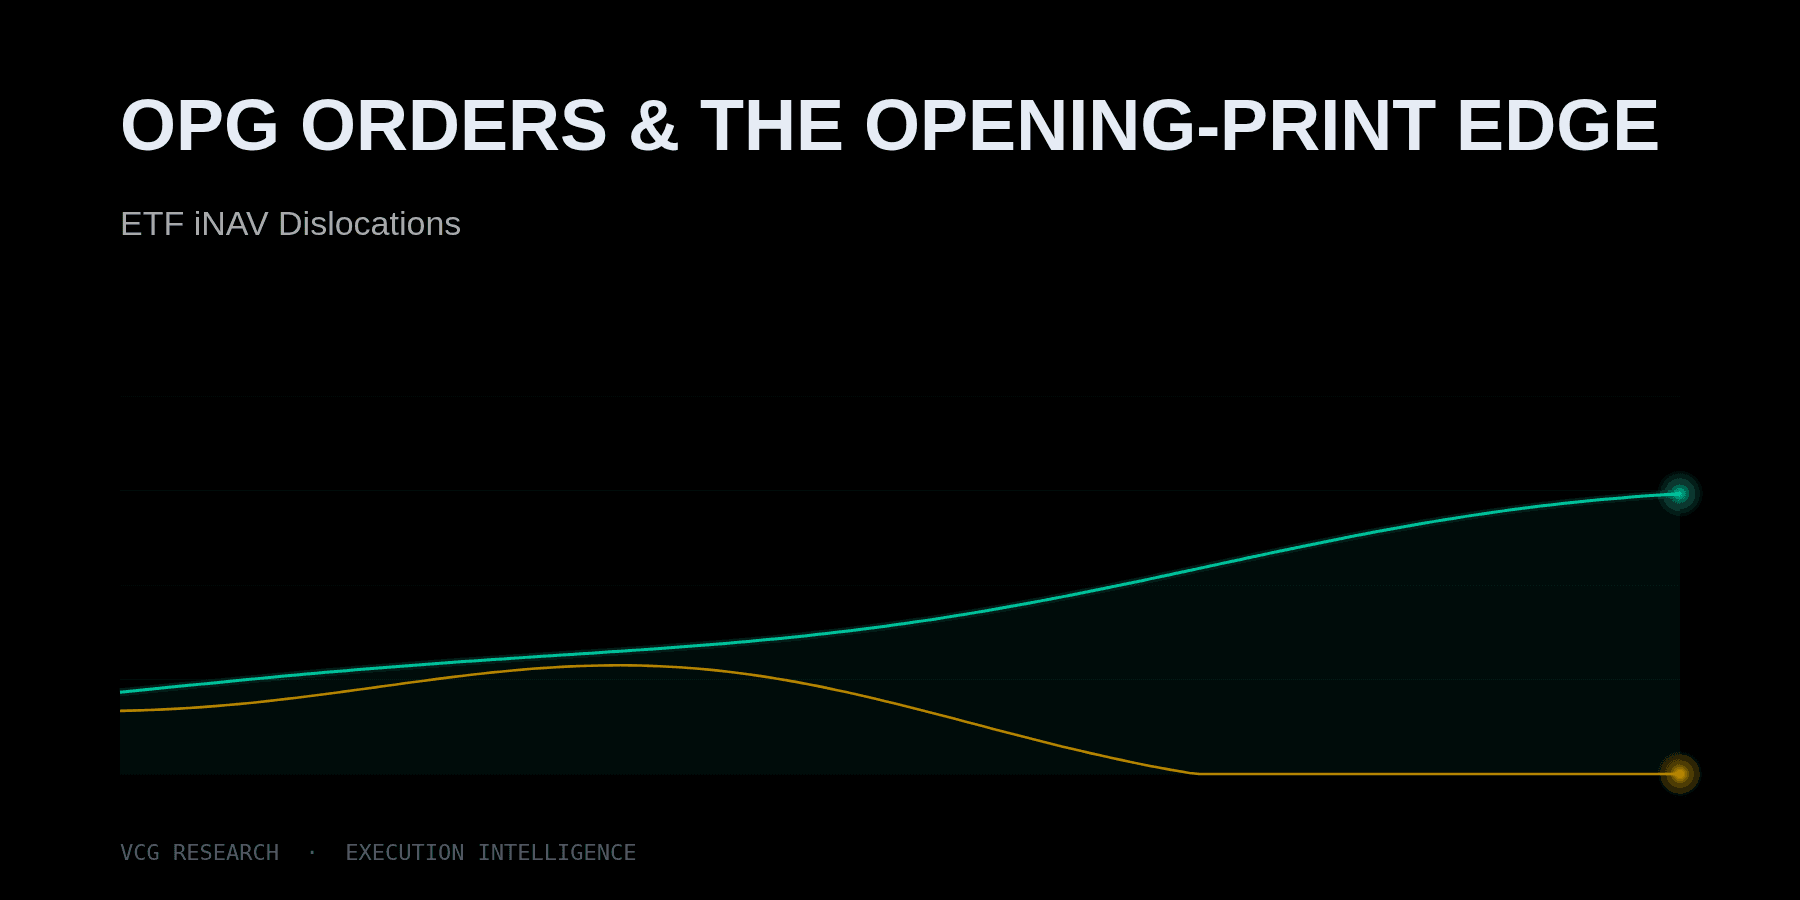
OPG Orders & the Opening-Print Edge: ETF iNAV Dislocations
How desks use OPG orders to capture ETF opening-print dislocations from iNAV: the mechanism, a worked example, and why the edge is real but thin.
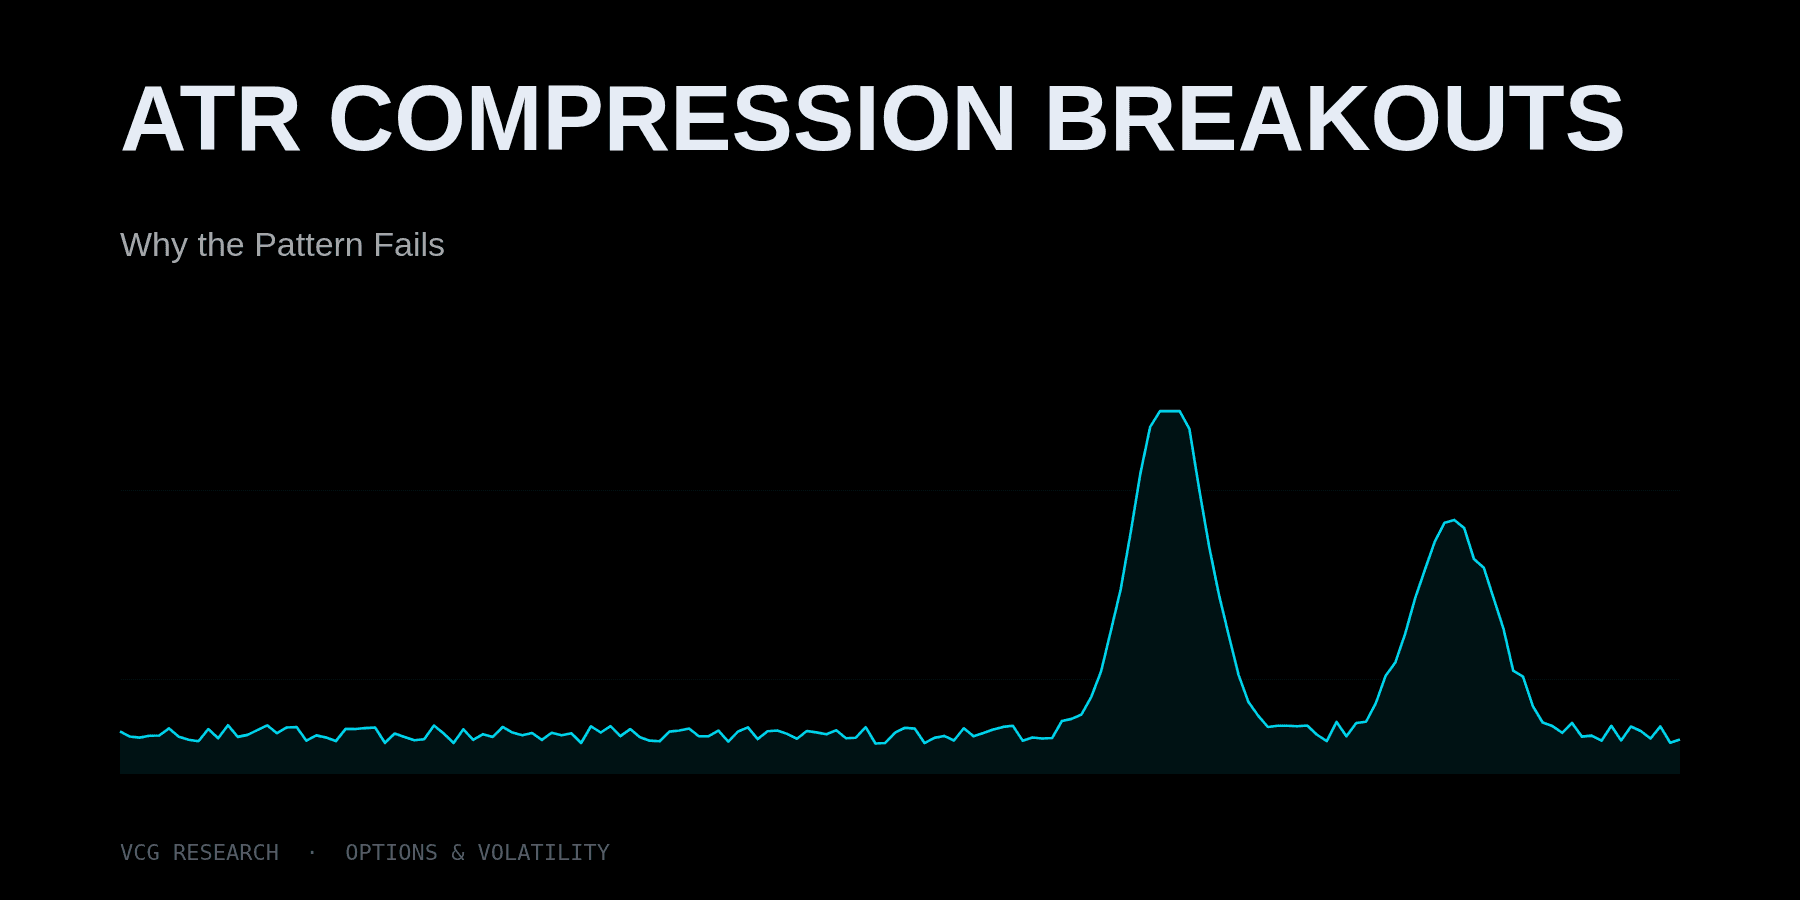
ATR Compression Breakouts: Why the Pattern Fails
8,688 sessions of high-beta data show ATR compression does NOT raise breakout probability - the opposite. How prop traders actually use compression (and what we trade).
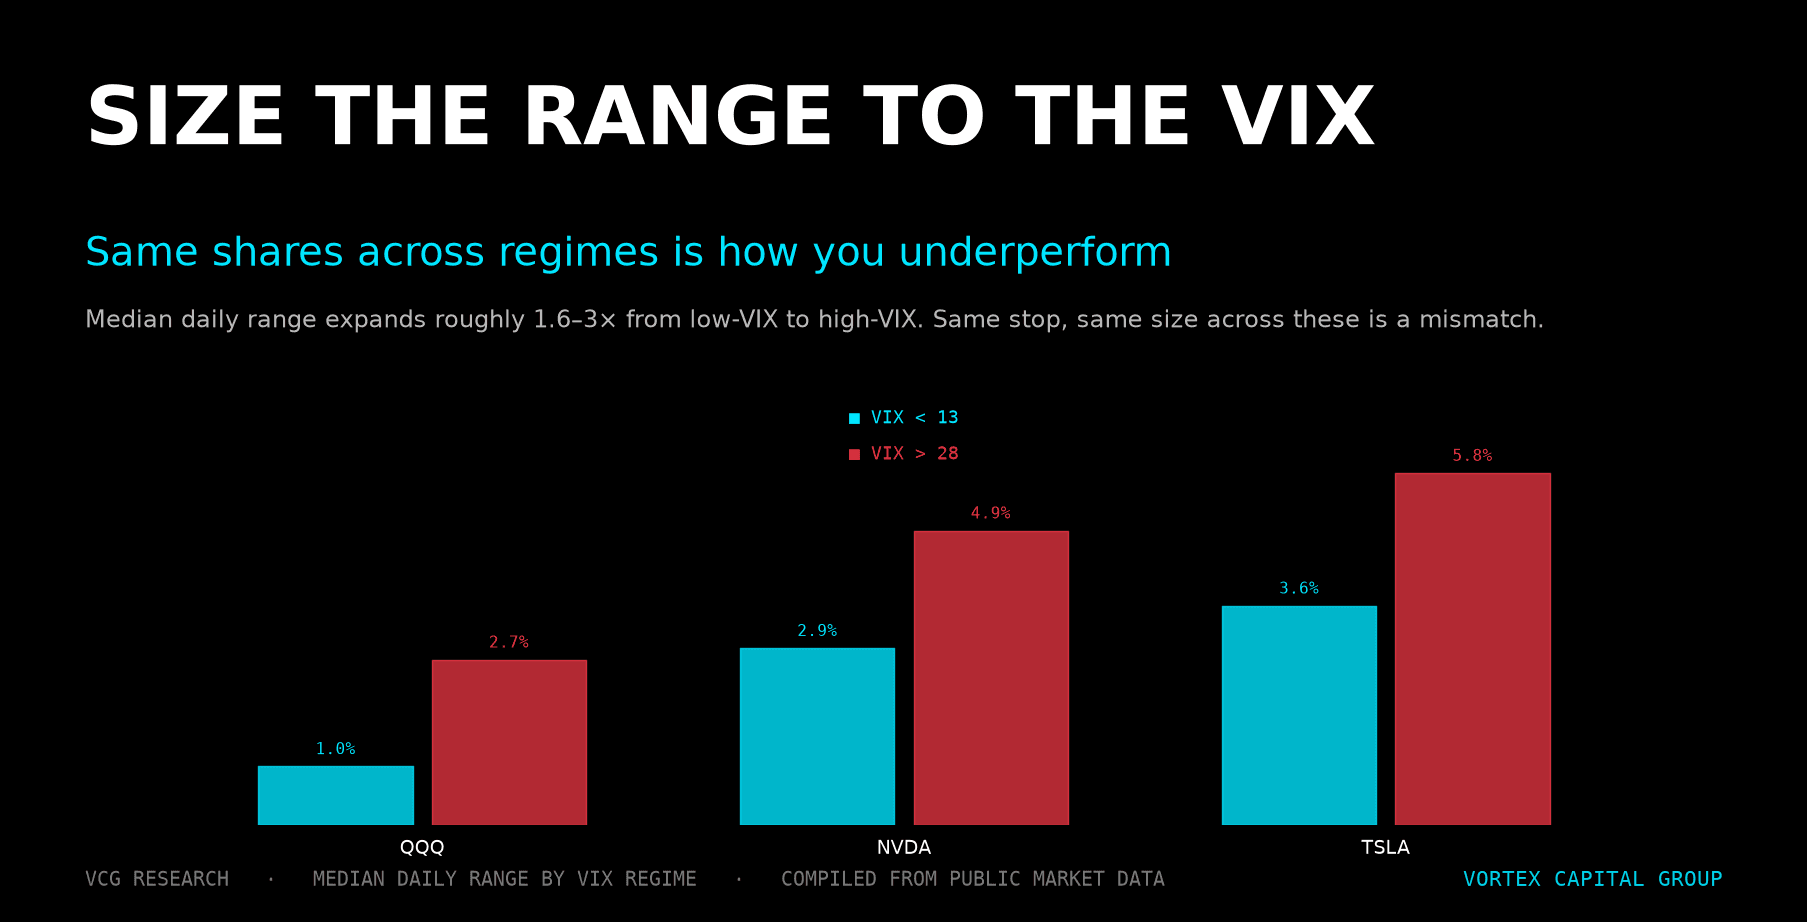
VIX-Adjusted Opening Range Sizing: QQQ, NVDA, TSLA
QQQ daily range is 3x wider at VIX 28 vs VIX 13. Same share size across regimes underperforms by design. A data-driven dynamic-sizing framework for prop day traders.
Singapore & Hong Kong Day Trading: The 22:30 US Open Routine
Singapore and HK traders own the cleanest US-equity time zone - the 09:30 ET open lands mid-evening with 4x the per-minute volatility. A data-backed desk routine.
China ADR Trading Playbook: BABA, NIO, JD, PDD & KWEB Flow
China ADRs decouple from KWEB more than traders assume - BABA correlation swings 0.45 to 0.85. The data-backed cross-session framework prop desks actually run.
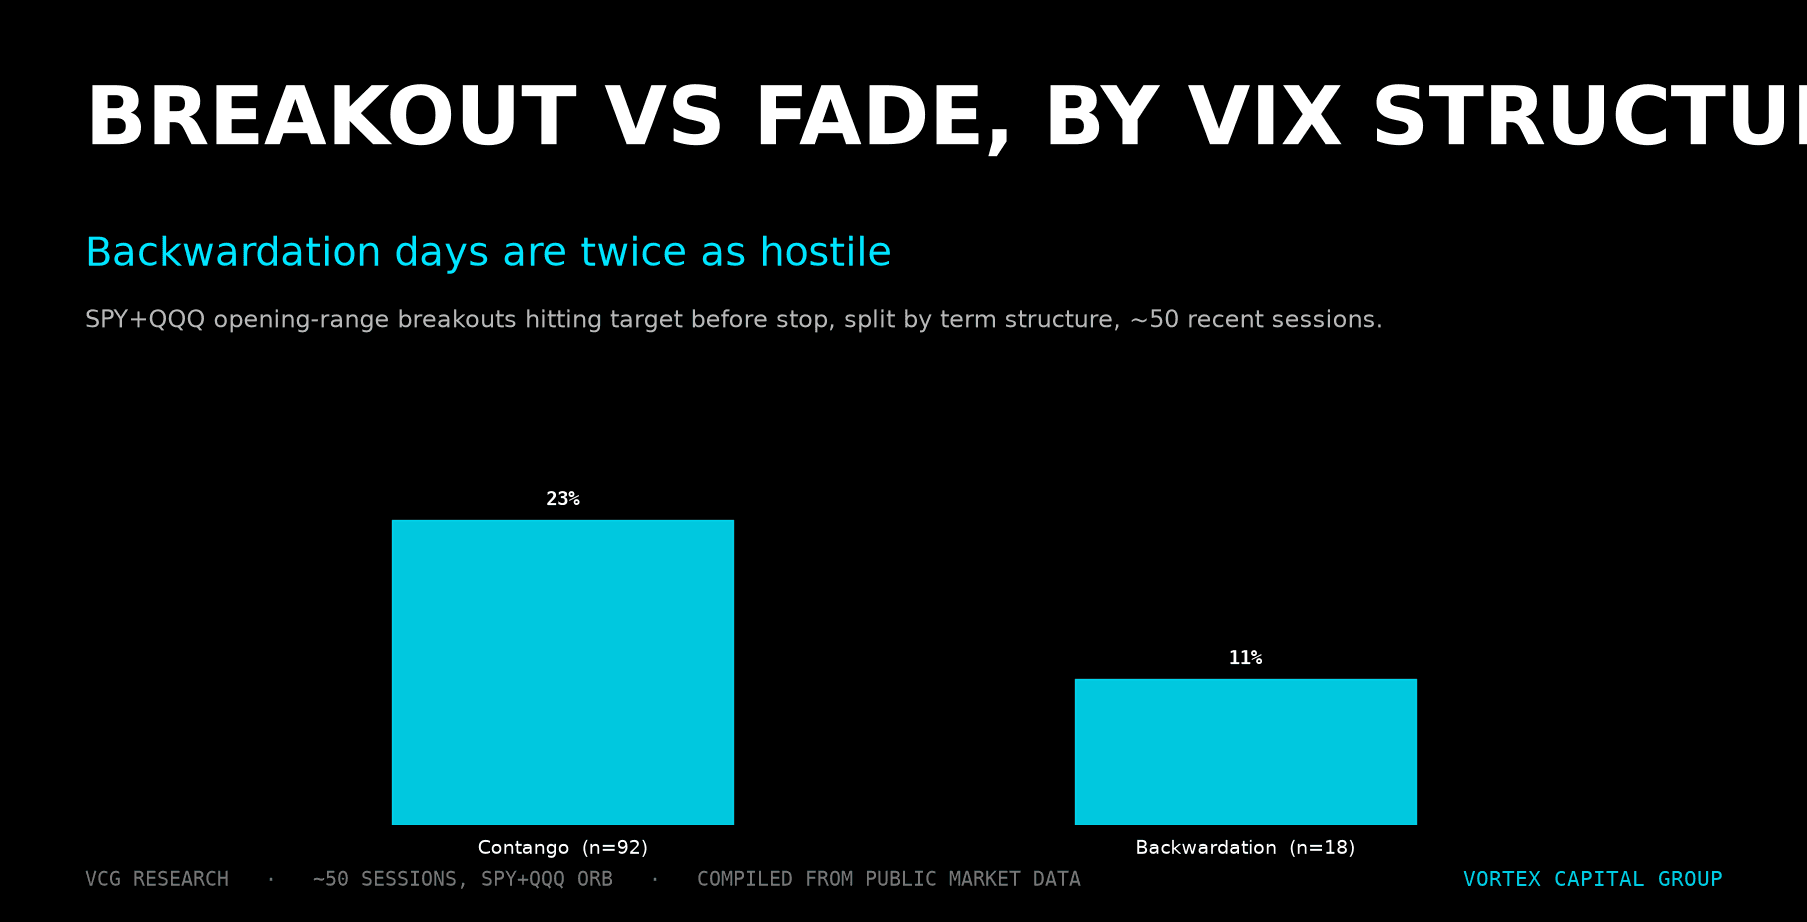
VIX Term Structure as a Breakout-vs-Fade Filter
Opening-range breakouts hit 23% in contango vs 11% in backwardation. How VIX/VIX3M conditions breakout follow-through, with the gamma mechanism behind it.
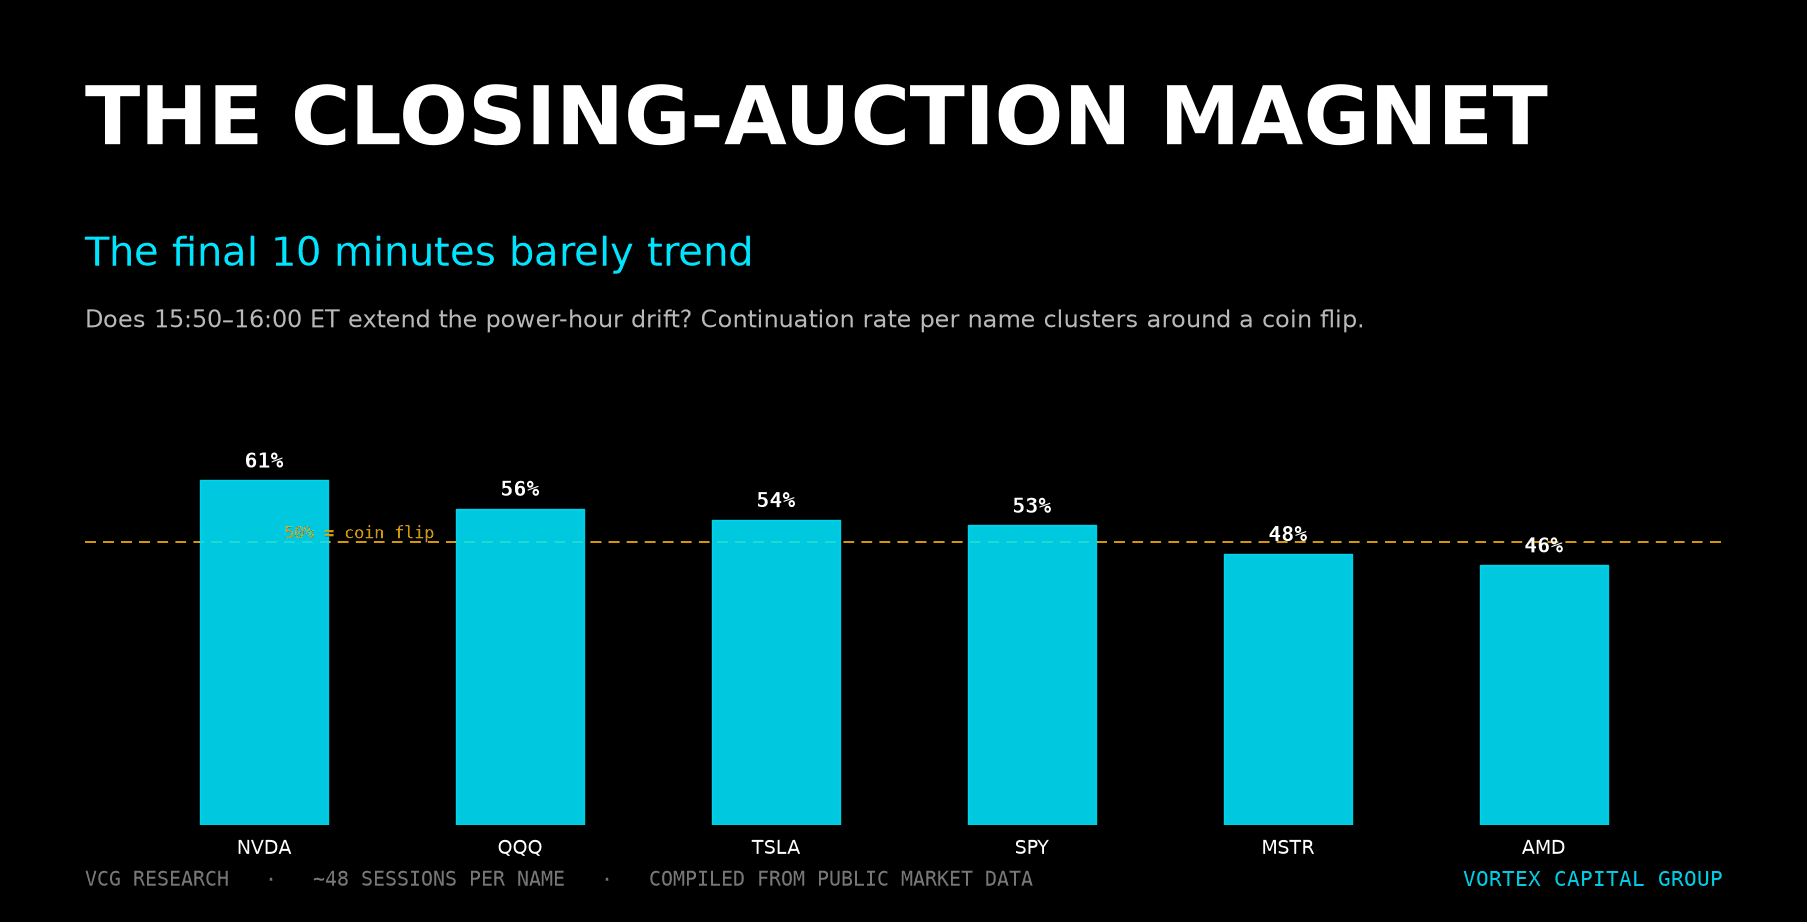
The Closing-Auction Magnet: What the Final 10 Minutes Actually Do
Data on ~48 sessions/name: the close extends the power-hour drift just 46-61% of the time. Which names tilt, how big the move is, and why route cost decides it.
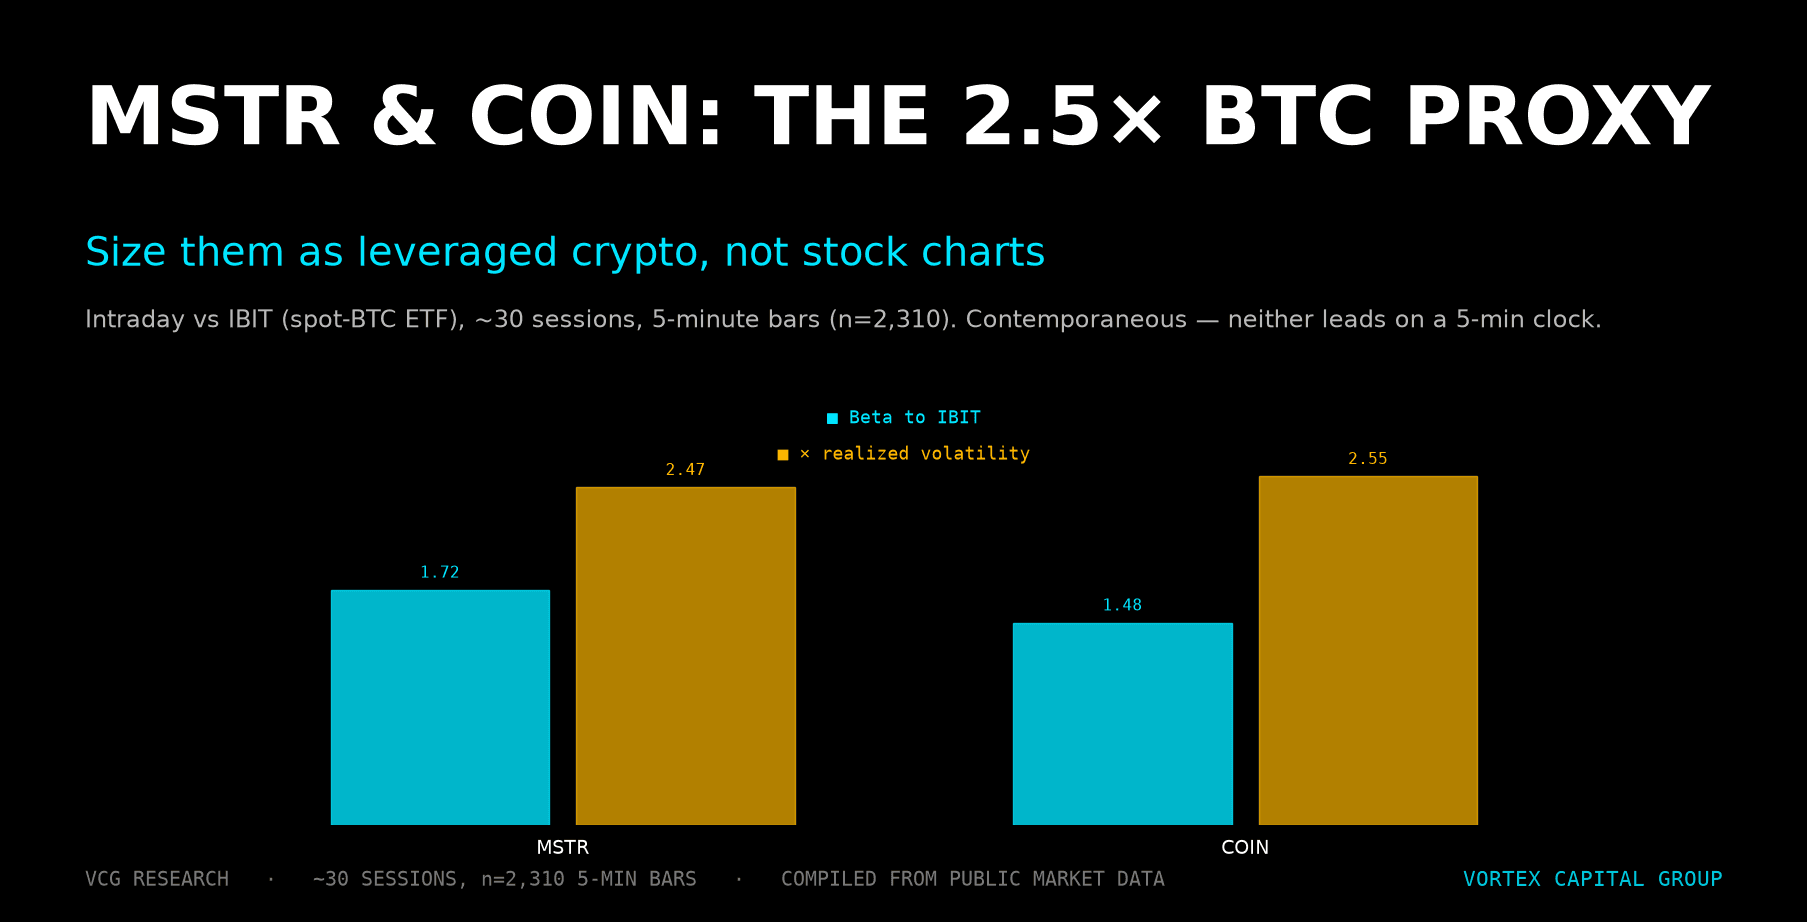
MSTR & COIN as Intraday Bitcoin Beta: Sizing the 2.5× Proxy
5-min data shows MSTR at 1.72 beta / 2.47× vol and COIN at 1.48 / 2.55× vs IBIT, with no lead-lag edge. How the desk sizes leveraged crypto proxies intraday.
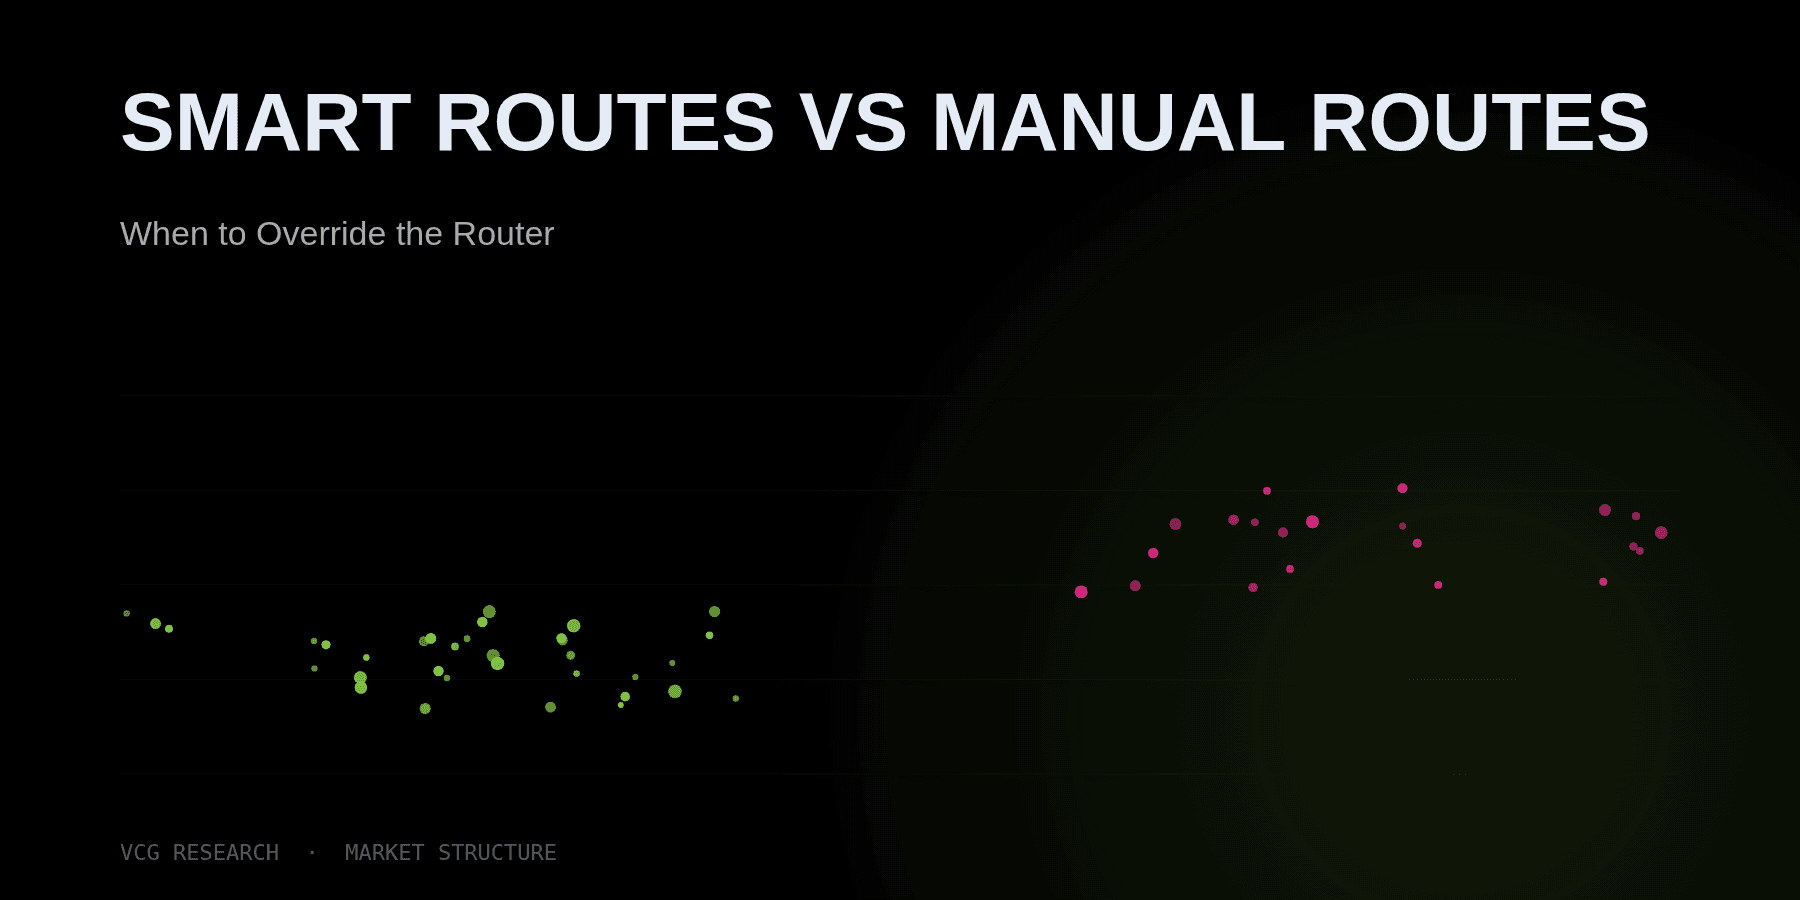
Smart Routes vs Manual Routes: When to Override the Router
When smart order routing works and when prop traders should override manually - SPY's intraday volume and range profile shows where each tool earns its keep.
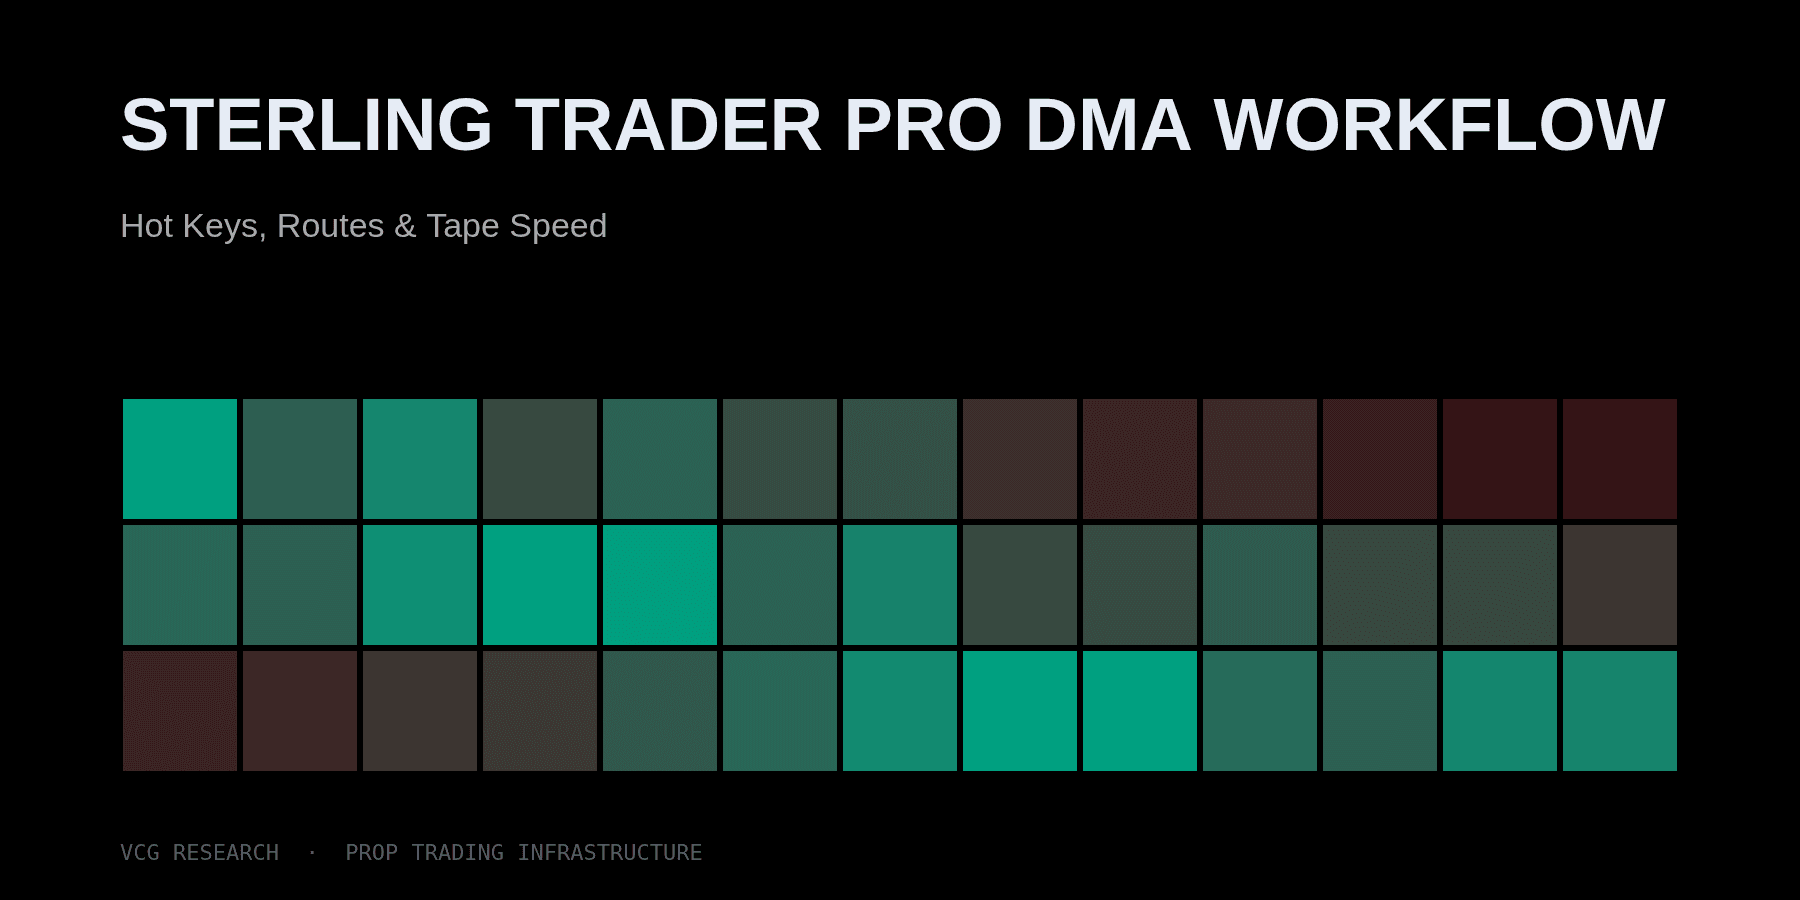
Sterling Trader Pro DMA Workflow: Hot Keys, Routes & Tape Speed
NVDA prints 9.8 bp per minute at the open vs 3.2 bp at lunch. Sterling Trader Pro's hotkey workflow is where active prop traders earn back the latency edge.
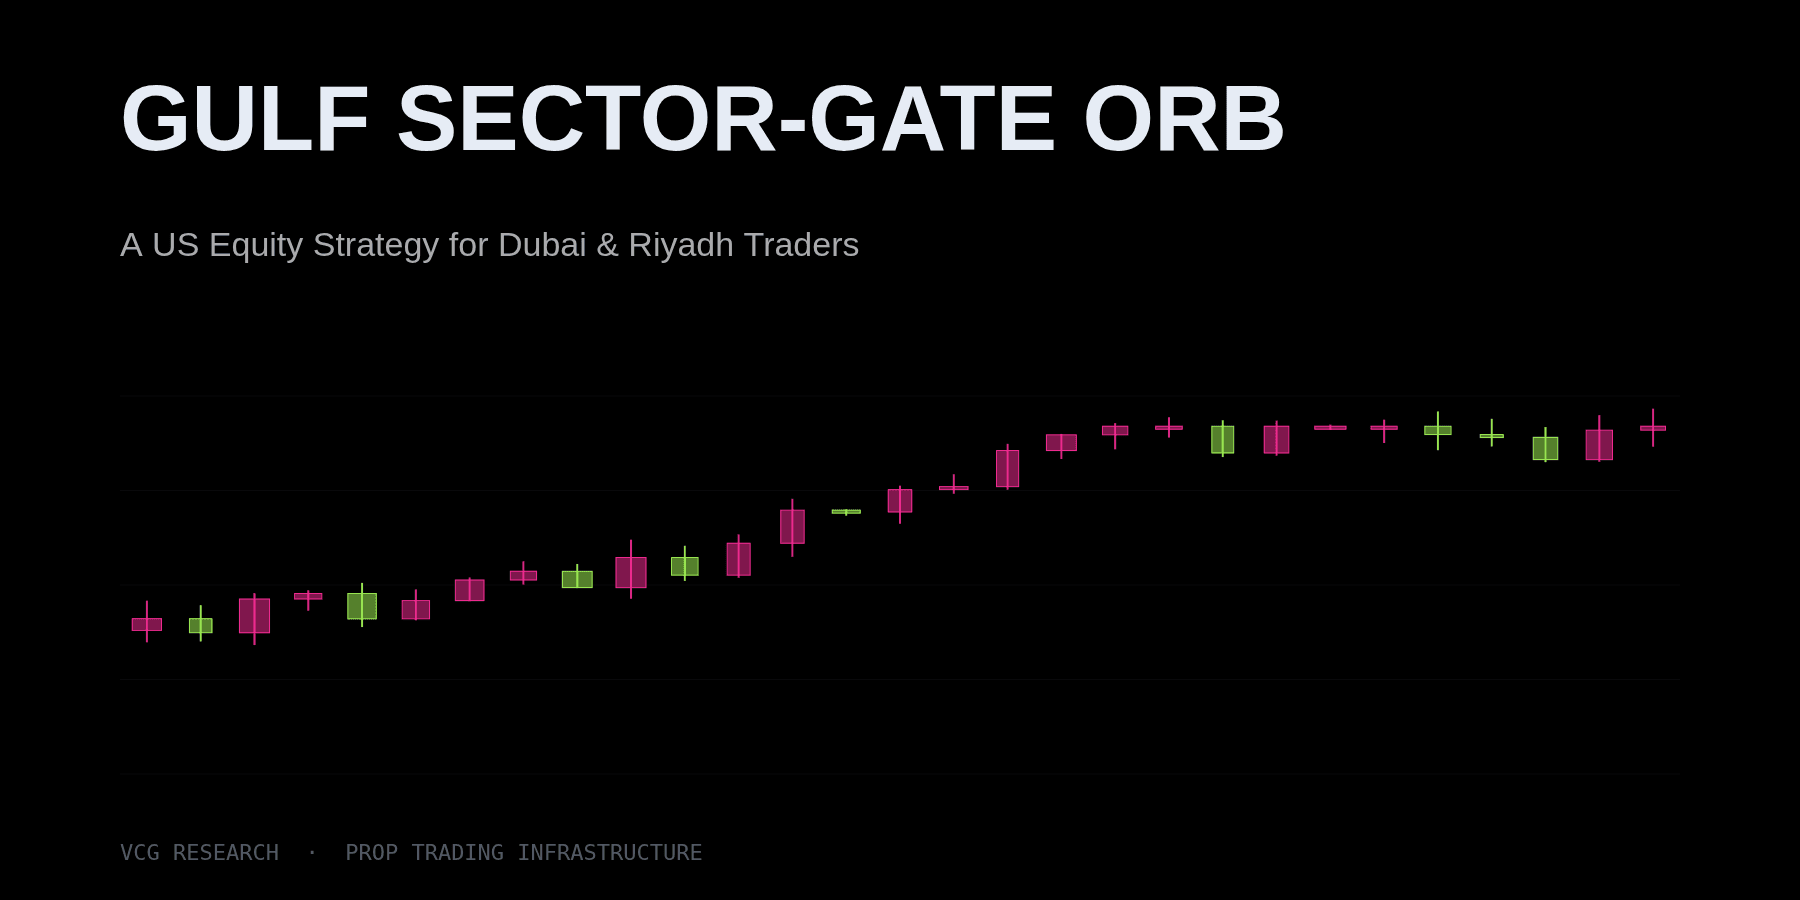
Gulf Sector-Gate ORB: A US Equity Strategy for Dubai & Riyadh Traders
Sector-gated ORB for Dubai, Abu Dhabi, Riyadh, Doha traders. QQQ + SMH confirmation at 10:15 NY = 18:15 Dubai. Recent 20-session study + DMA execution framework.
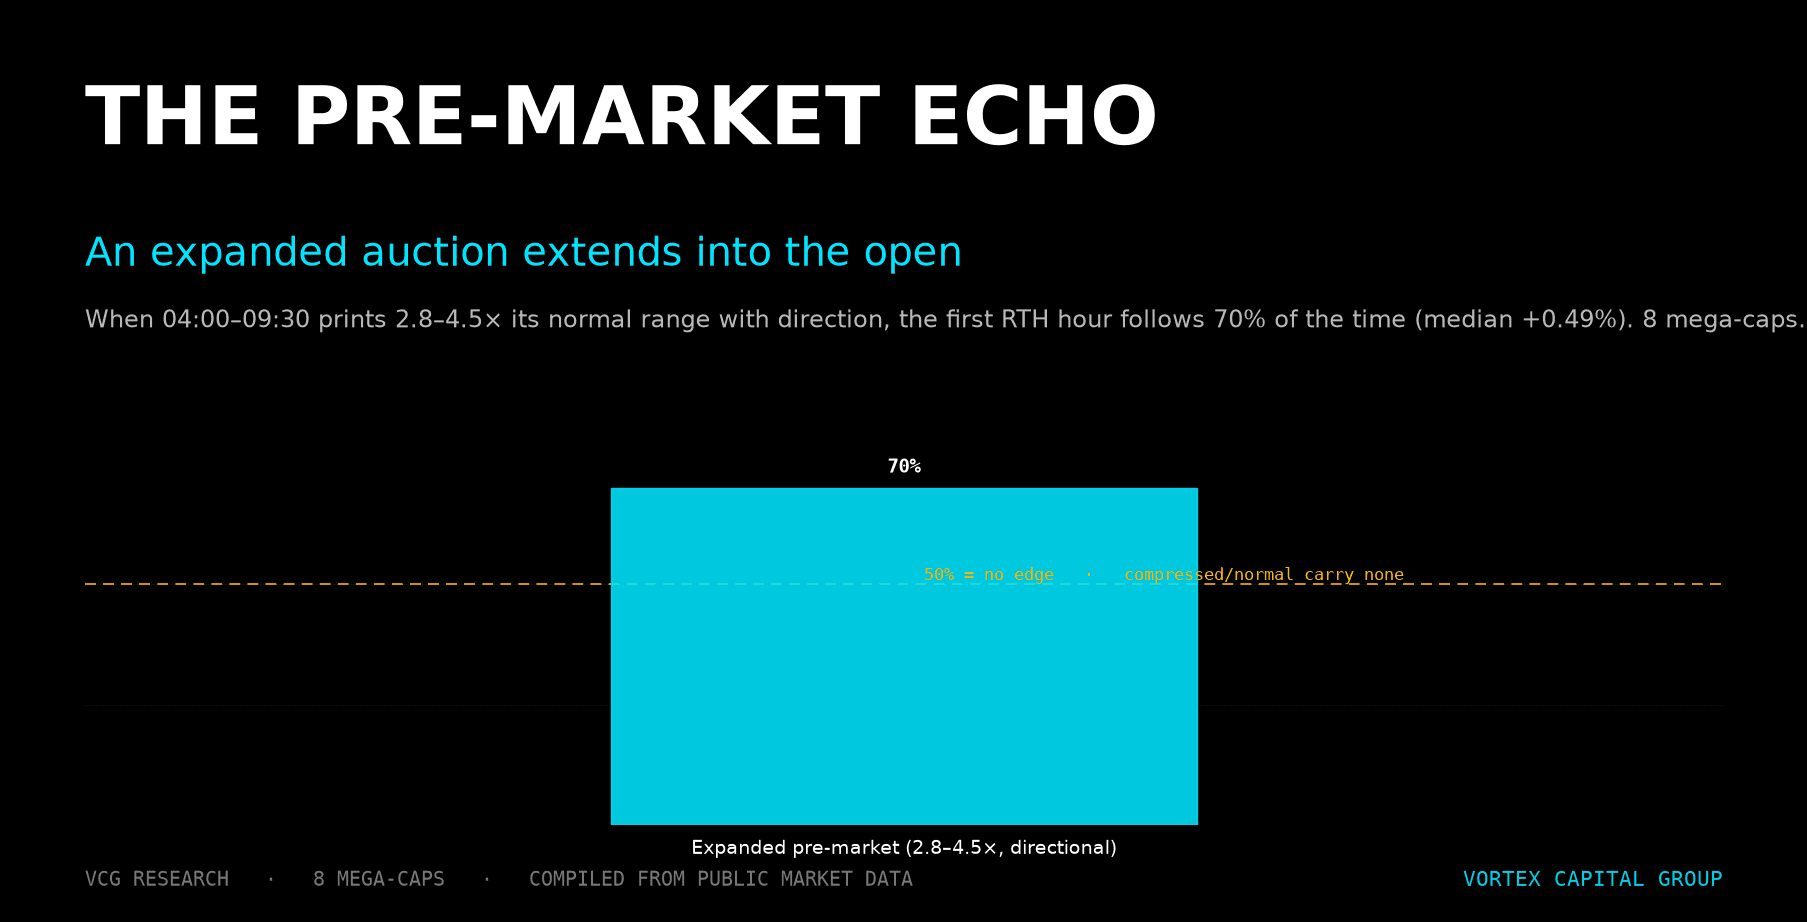
Pre-Market Range and First-Hour US Equity Trading
A Vortex study of how the 04:00-09:30 ET pre-market range predicts first-hour US equity behavior and opening range execution.
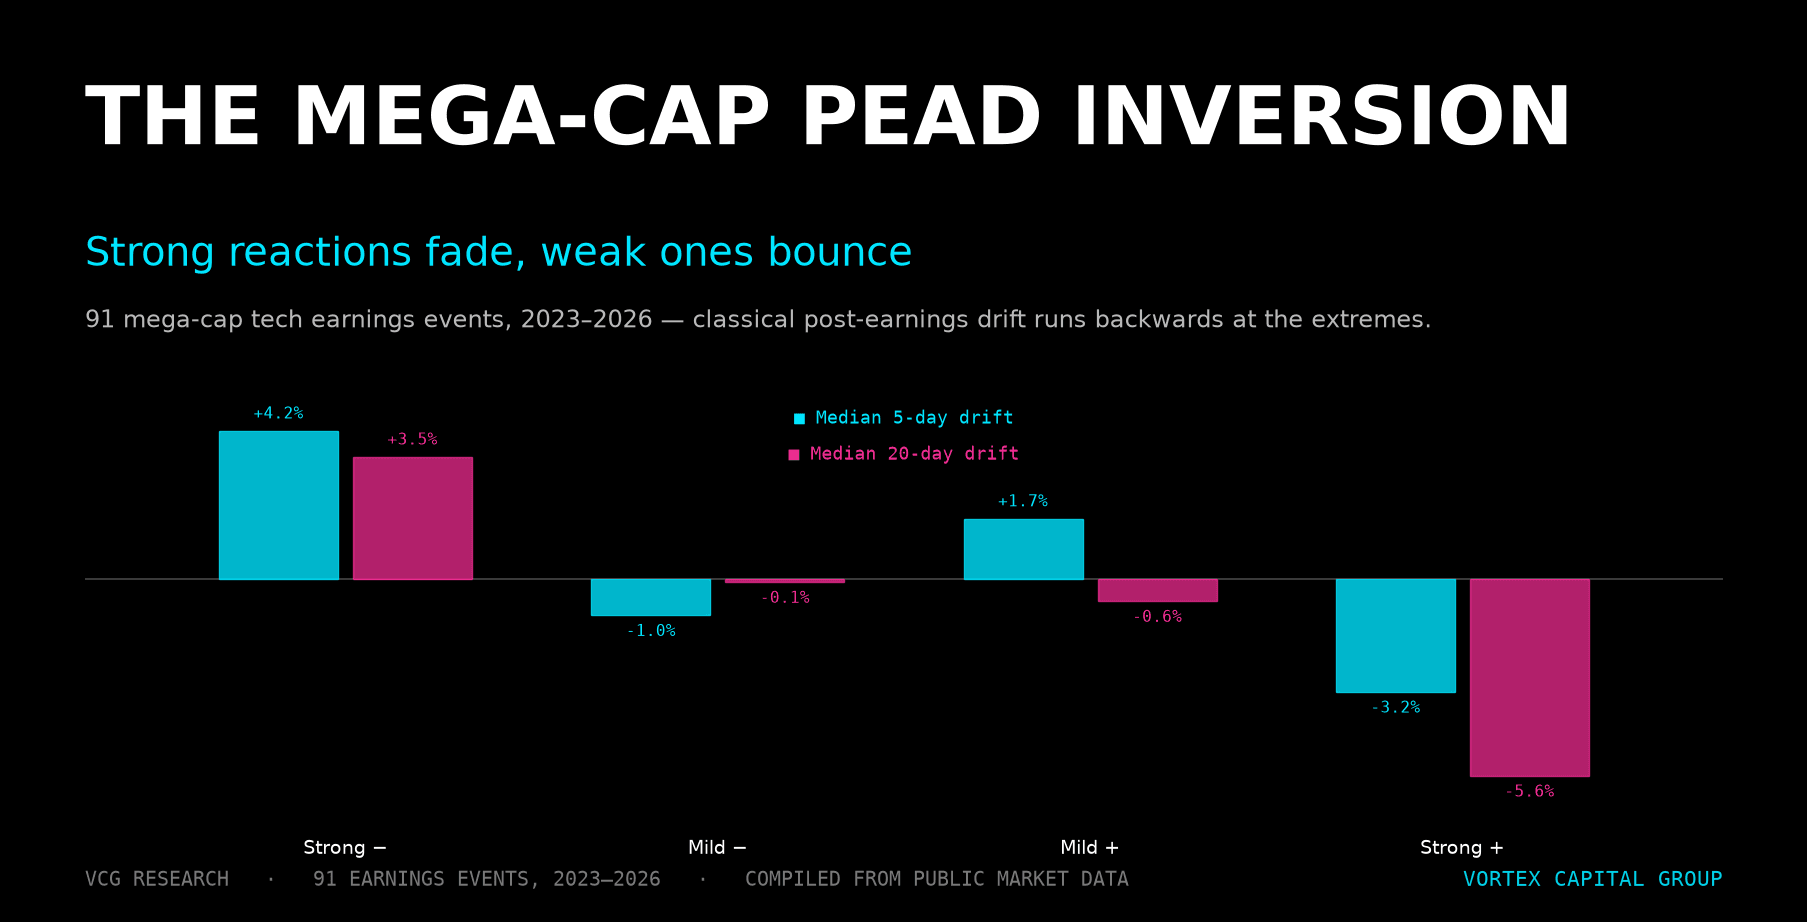
The Mega-Cap PEAD Inversion
Mega-cap US tech earnings inverted classical PEAD between 2023 and 2026. Strong reactions fade, weak ones bounce - and the reason is microstructural.
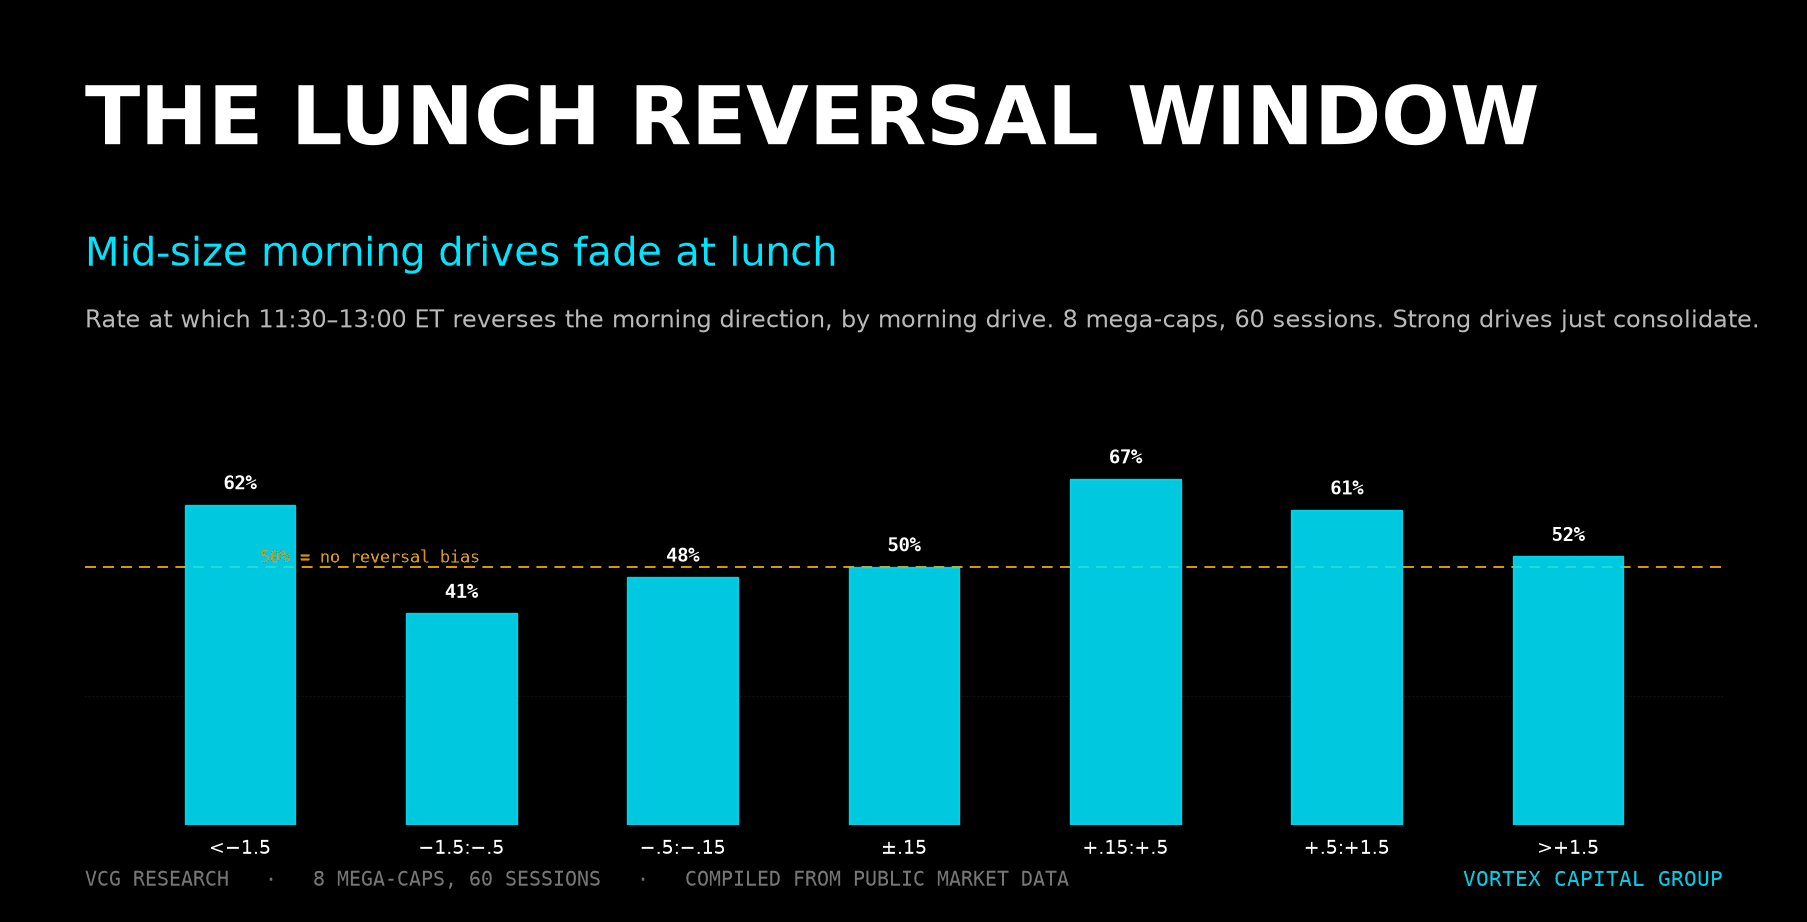
Lunch Reversal Window: 11:30-13:00 ET Fade Study
A Vortex study of why mid-size US equity morning drives often fade between 11:30 and 13:00 ET, with execution rules for active day traders.
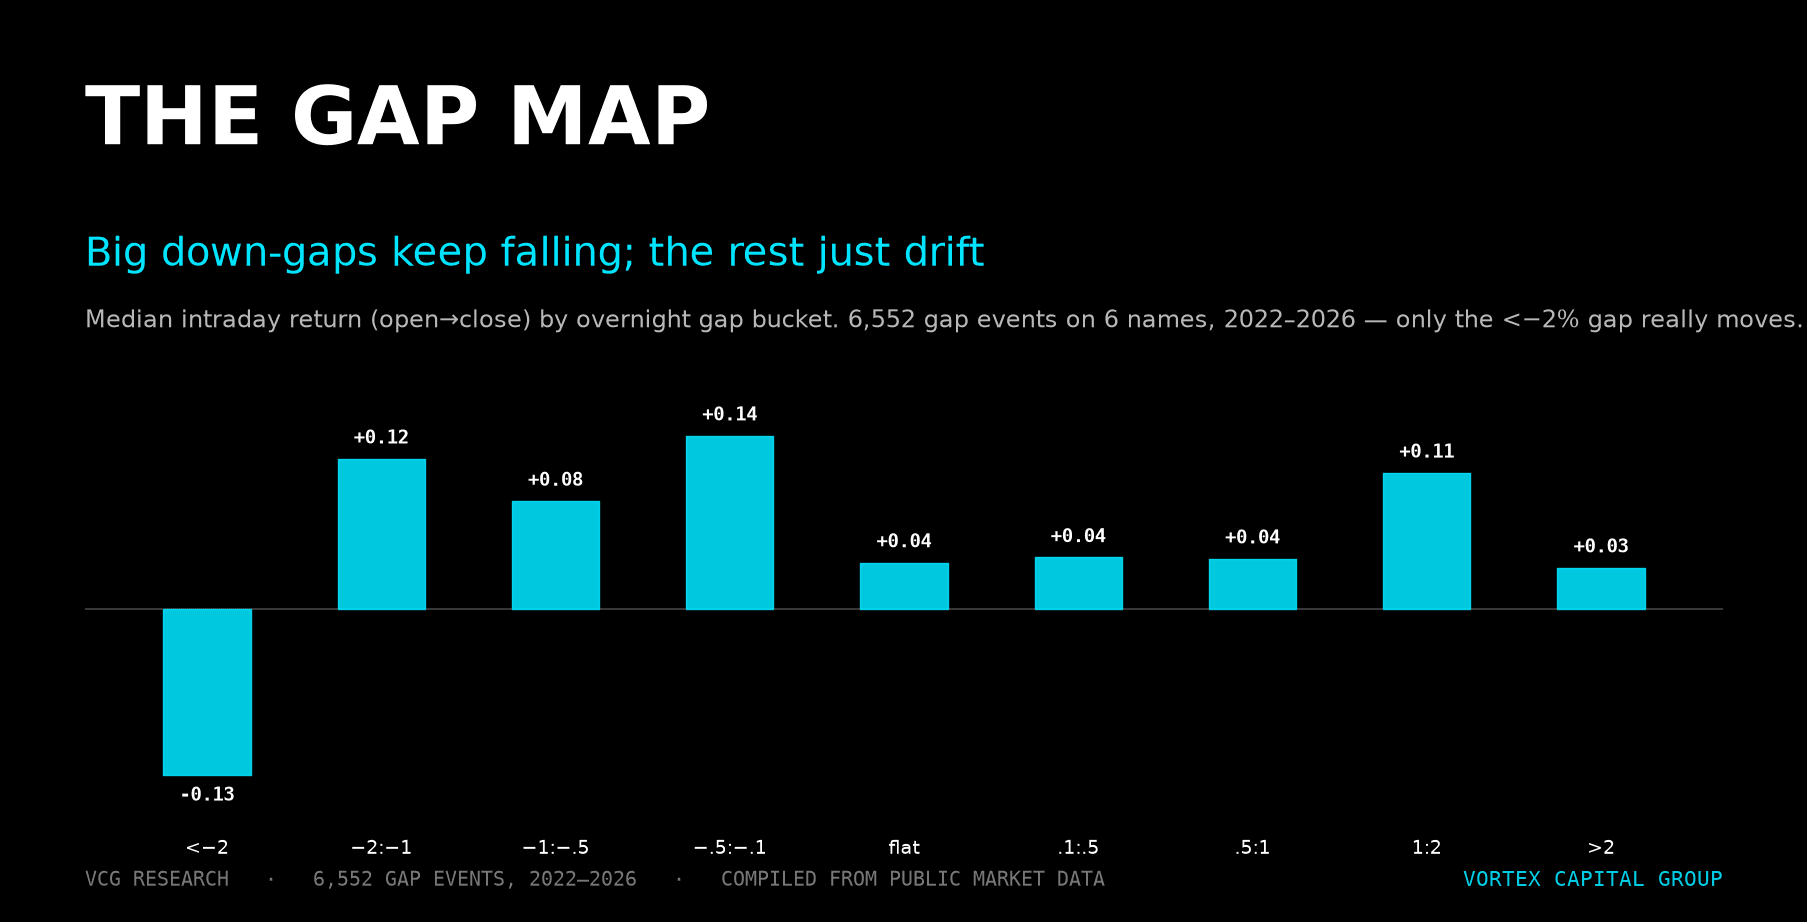
The Gap Map: When US Equity Gaps Continue and Fade
A 6,552-event study of US equity overnight gaps. Large gaps fade, mid-size gaps drift, and the first 30 minutes tell you the regime.
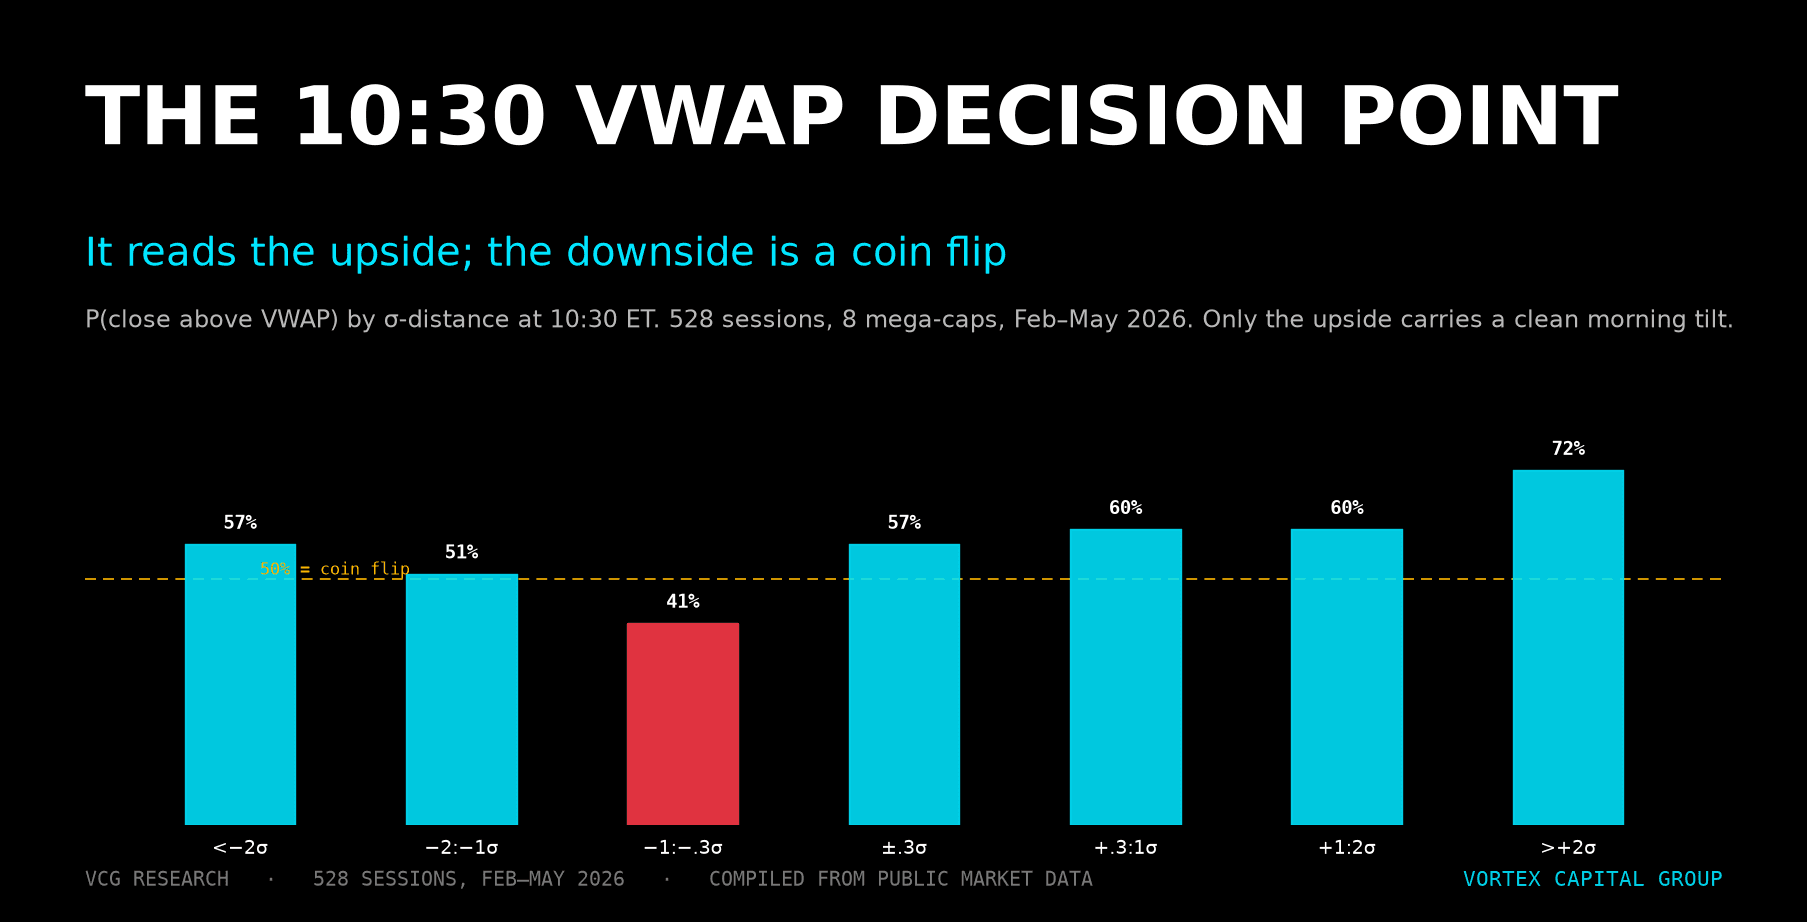
10:30 VWAP Decision Point for Day Traders
How our firm uses sigma-distance from VWAP at 10:30 ET to frame end-of-day probability, route urgency, and risk for active US equity traders.
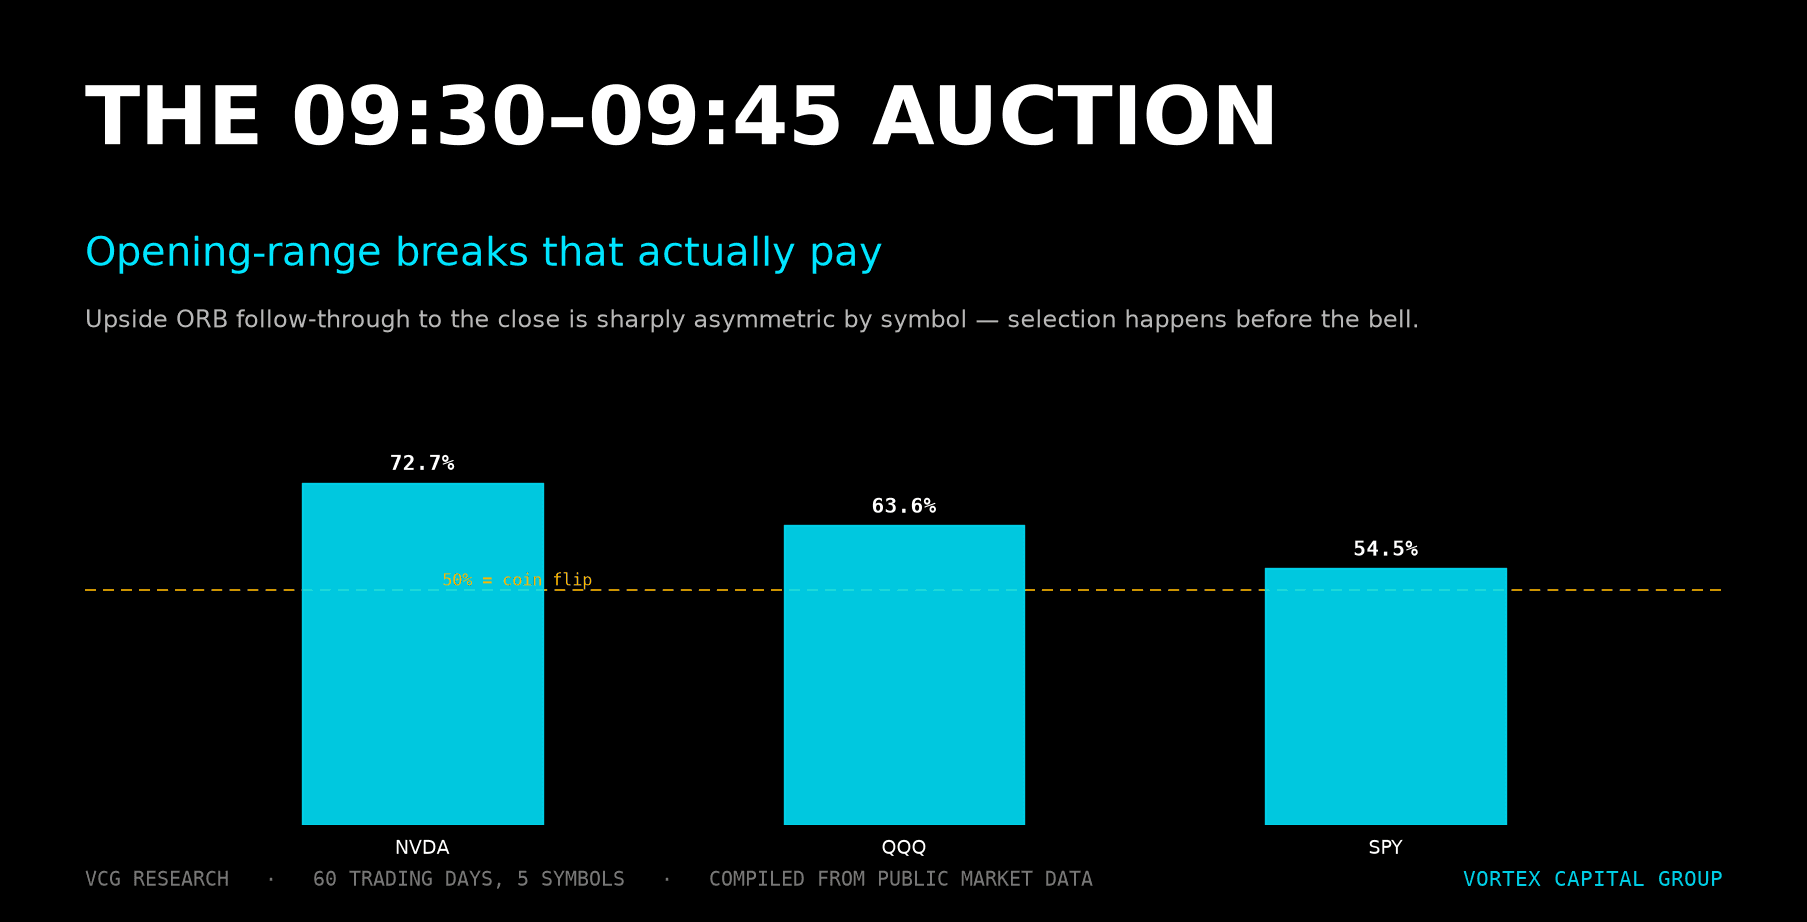
Opening Range Breaks That Actually Pay
A 60-day data study of 09:30-09:45 opening range breaks across SPY, QQQ, IWM, NVDA, TSLA. The pattern is sharply asymmetric by symbol and regime.
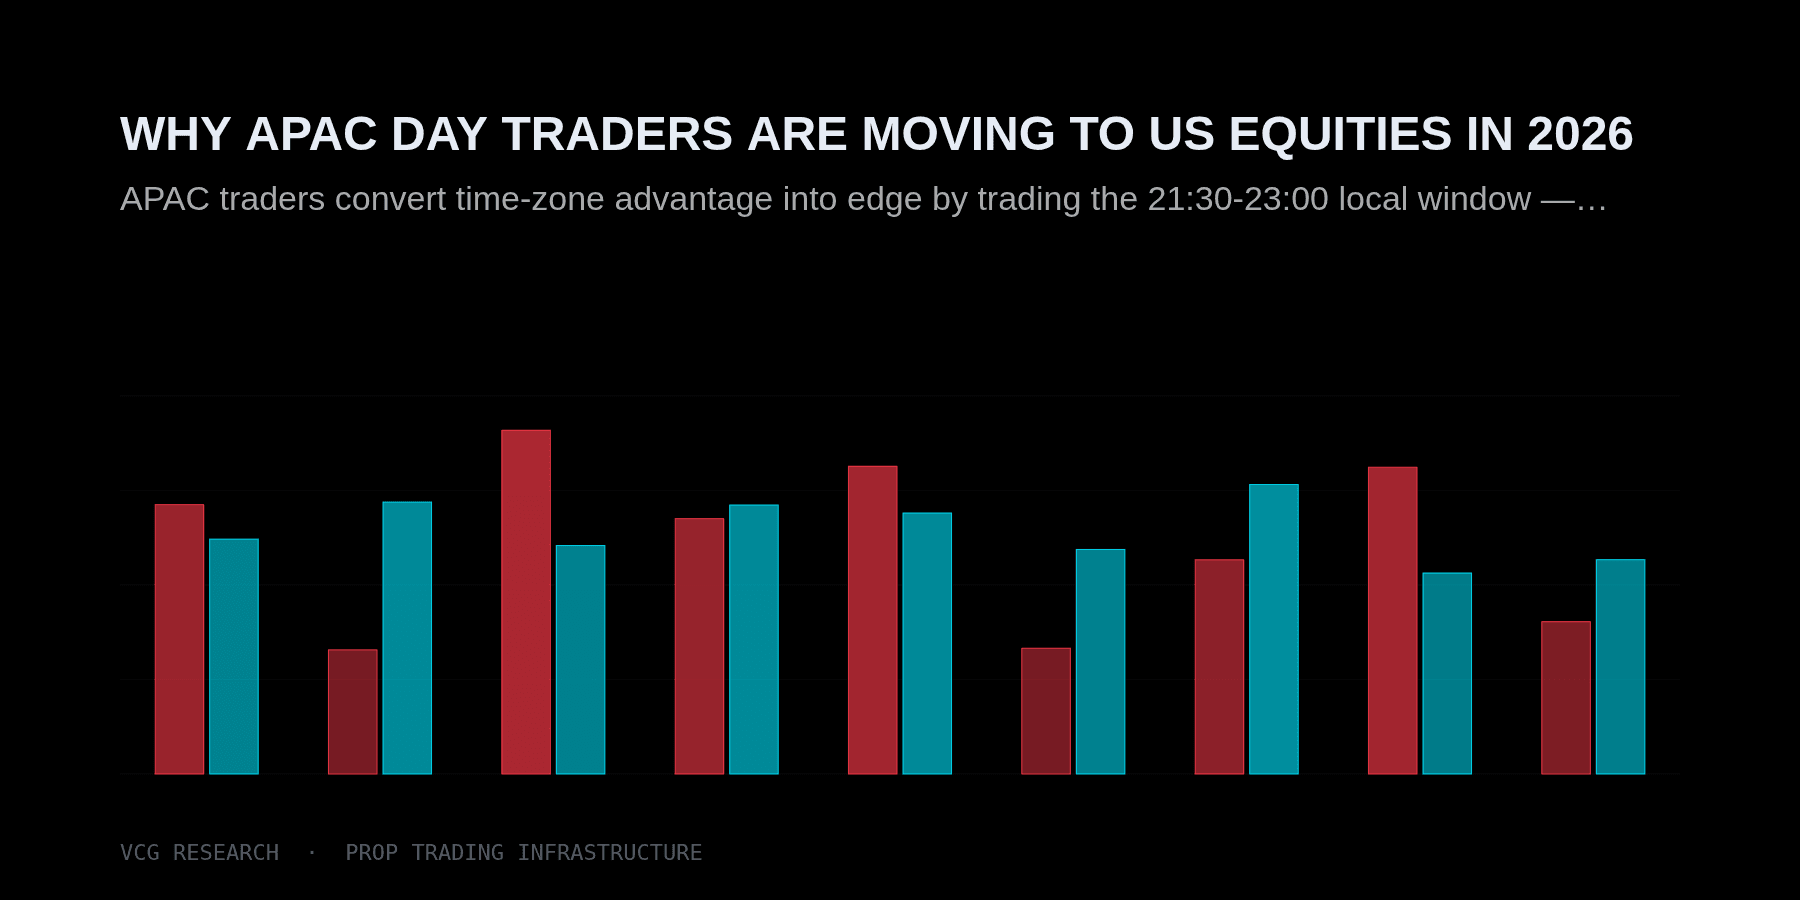
Why APAC Day Traders Are Moving to US Equities in 2026
APAC traders convert time-zone advantage into edge by trading the 21:30-23:00 local window - 4× the per-minute volatility of any other US session window.
Trading US Equities from Seoul: What Korean Day Traders Need to Know
Korean traders own one of the cleanest US-equity time zones. KOSPI predicts SPY gap size, not direction - and the first-5-minute reversal data shows why.
Trading US Equities from China: Infrastructure, Platform Access & Cross-Market Reads
What China-based active traders need to trade US equities professionally: DMA, HTB locates, multi-clearing, and the cross-session reads that earn the time-zone edge.
The PFOF Tax: The Hidden Cost of Retail Execution for Active Traders
Zero commission isn't free. A 1-3 bp per-side route drag erases a real share of the 1-minute range on active strategies. How the desk measures implementation shortfall.
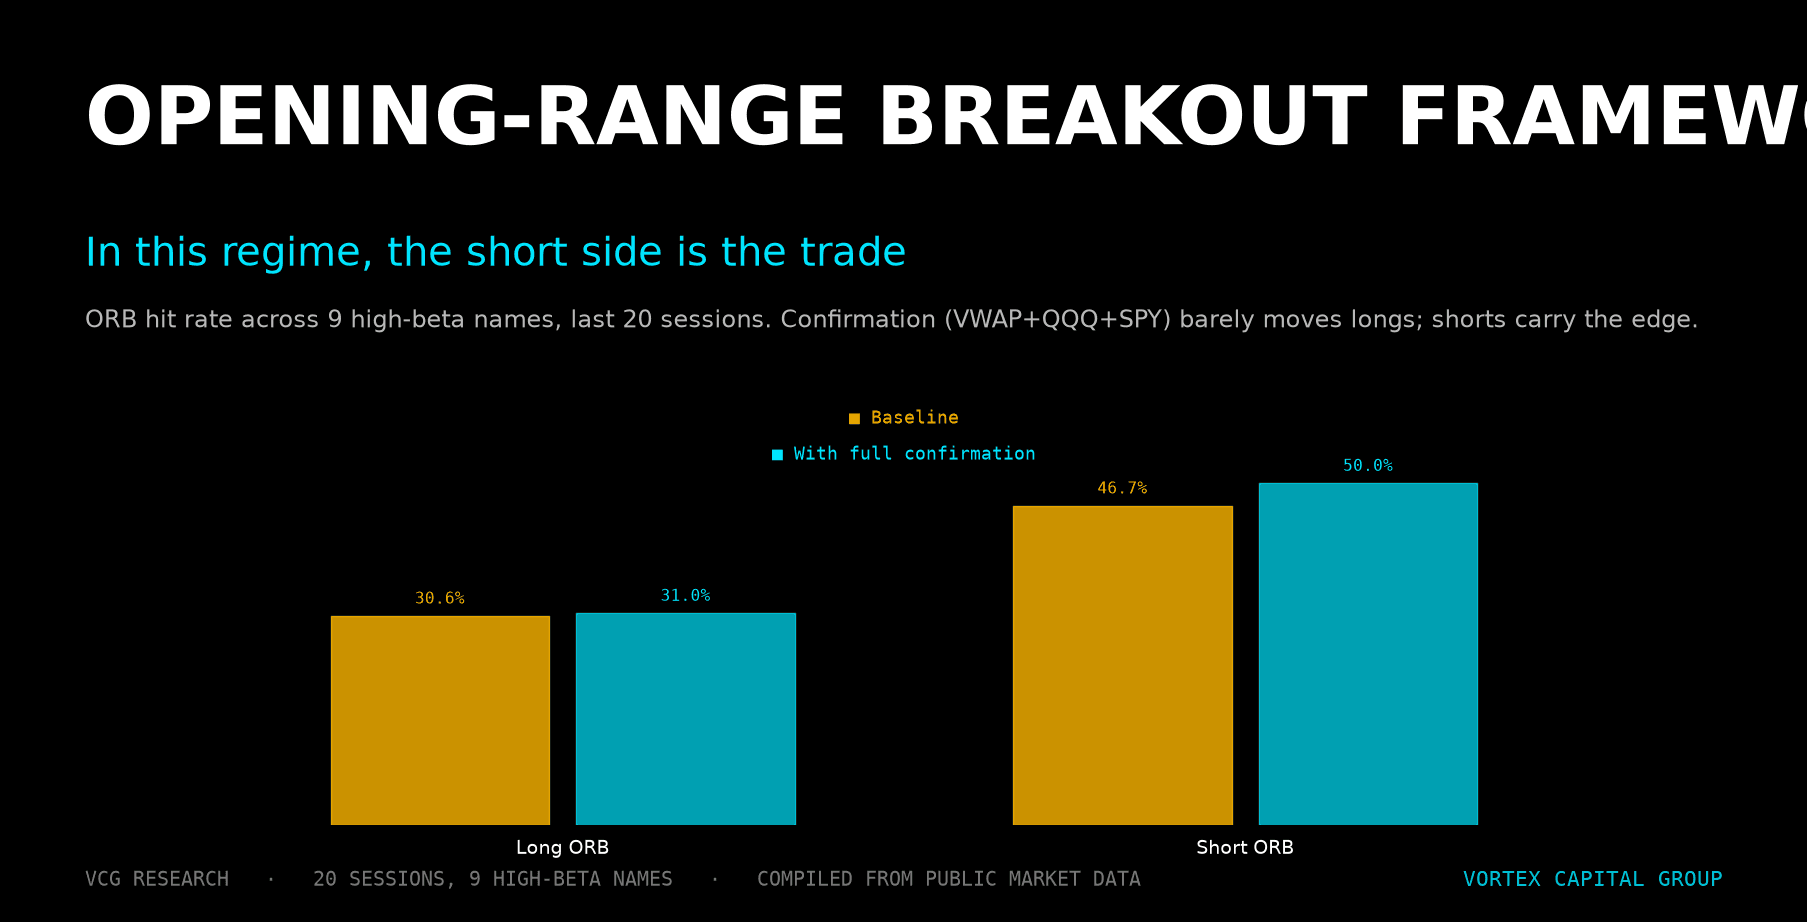
ORB Statistical Framework: Why the Long-Short Asymmetry Has Inverted
The ORB long-vs-short asymmetry has flipped: short ORB now 47% baseline, 50% with confirmation; long ORB only 31%. Data, mechanics, and desk rules.
Dark Pool Liquidity: When Prop Traders Route Off-Exchange
Dark pools aren't a magic edge - FINRA data shows off-exchange flow splits between ATS and wholesalers. A four-cost framework for when dark routing actually helps.
Multi-Clearing Firm Access: Why Borrow, Margin & Routing Improve
Multi-clearing access is operational edge on the days that matter most - borrow availability, margin formulas, route flexibility and recall response all vary by clearer.
Reading Level 2 Like a Prop Trader: Queue, False Depth, Refresh Behavior
What prop traders actually look at on Level 2 - queue refresh, false depth, asymmetric clearing, and the four questions before trusting displayed depth as a signal.
Hard-to-Borrow Mechanics: The Hidden Cost Layer in Short Selling
The complete framework for trading HTB names. Borrow tax curve, Reg SHO mechanics, term vs open borrow, recall risk, and the desk decision tree.
DMA vs Retail Broker Execution: Where Your Edge Actually Goes
Retail routing surrenders the most edge at the open and close - where active traders make 70% of P&L. A data-driven framework for DMA, Rule 605/606, and venues.
Four HTB Vendors: Why Multi-Vendor Redundancy Is Short-Side Survival
One HTB vendor is a single point of failure on names like UPST, BYND and AMC. The operational case for four-vendor borrow redundancy and the workflow that delivers it.
Trading US Equities from Overseas: What International Prop Traders Should Evaluate
DMA quality, multi-vendor HTB locates, multi-clearing, real-time order flow - what international prop traders should evaluate before trading US equities from abroad.
GWOFT: Global Weighted Order Flow Timing for Overseas US Equity Traders
GWOFT - a session-overlap map of where overseas participation amplifies US tape speed. SPY runs 2.66 bp/min in the EU overlap vs 1.36 mid-afternoon.
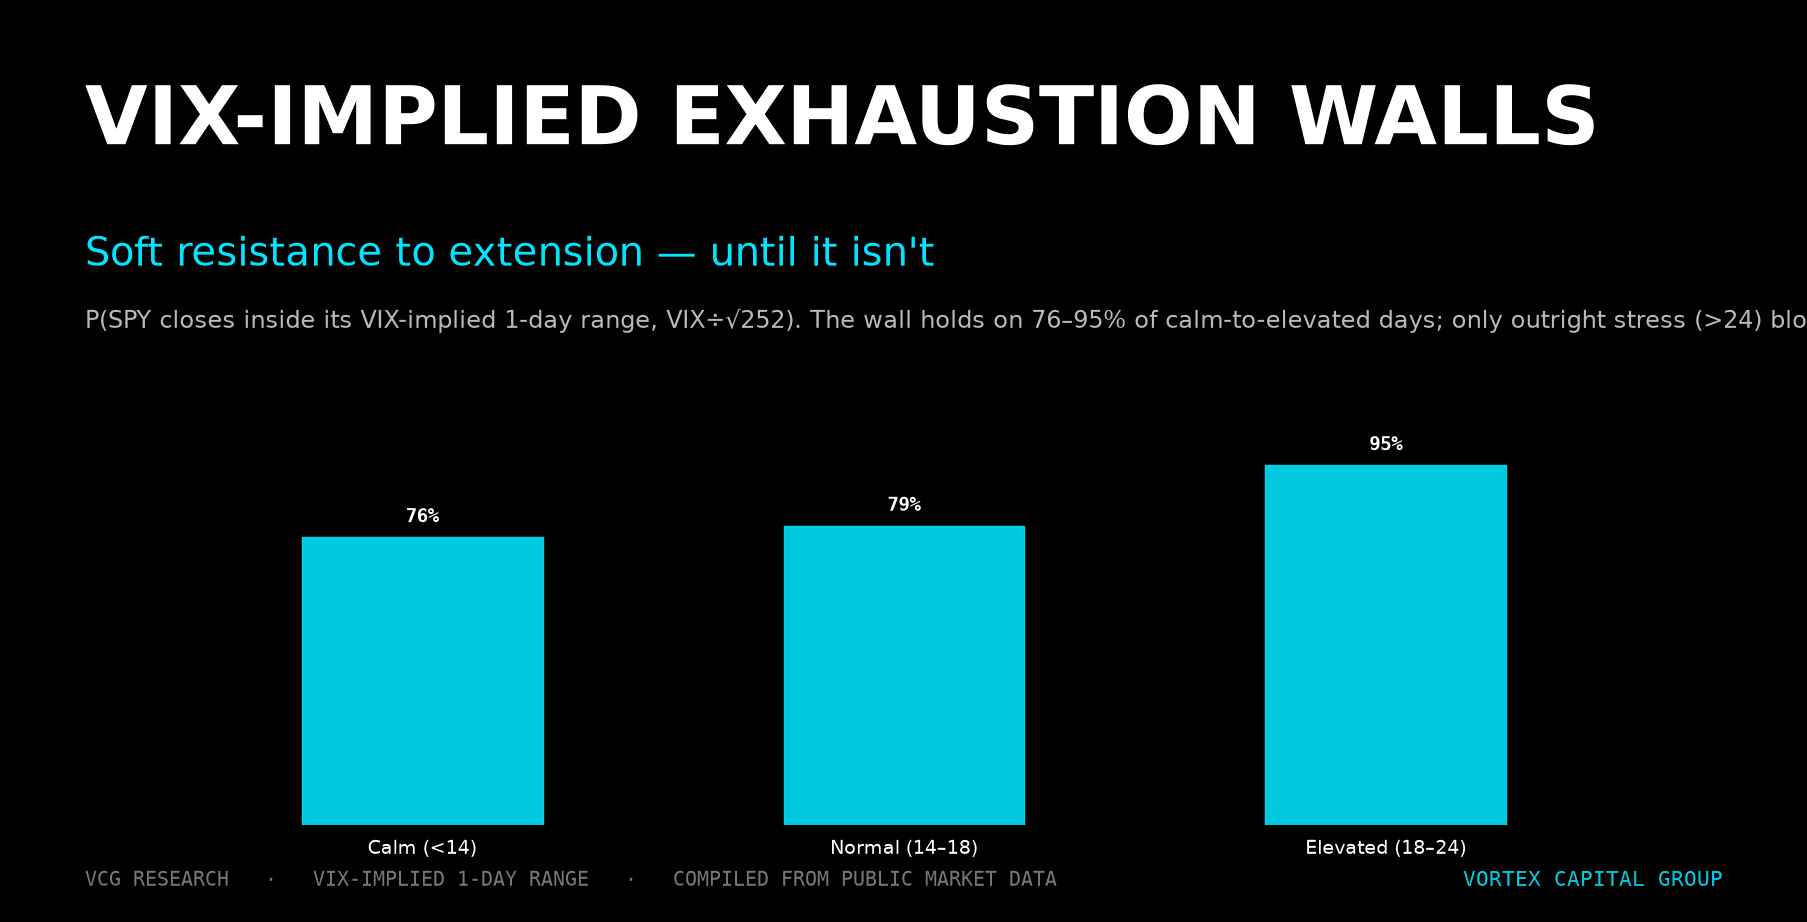
VIX Implied Exhaustion Walls: Mapping Where Momentum Runs Out
SPY closes inside its VIX-implied 1-day band on 76-95% of sessions - except in stressed VIX regimes, where the wall breaks. A volatility-adjusted momentum check.
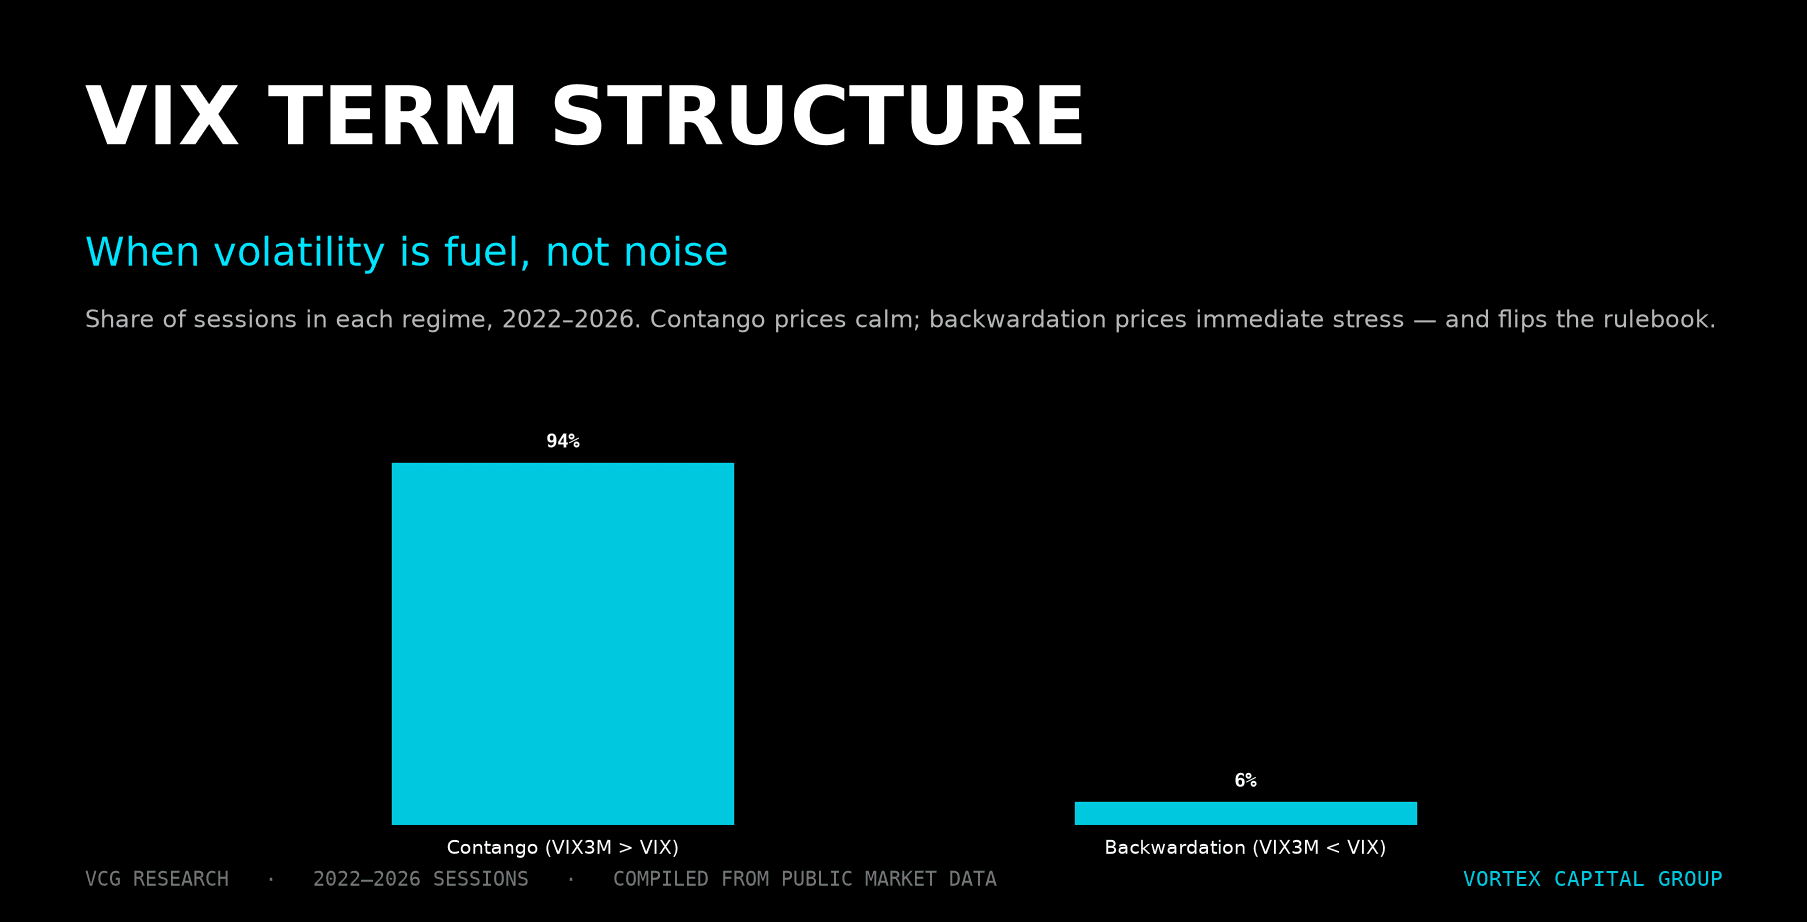
VIX Term Structure for Day Traders: When Volatility Is Fuel, Not Noise
The VIX3M - VIX spread separates calm tape (contango, 94% of sessions) from stress (backwardation, 6%) - different rules in each. A 30-second pre-open check.
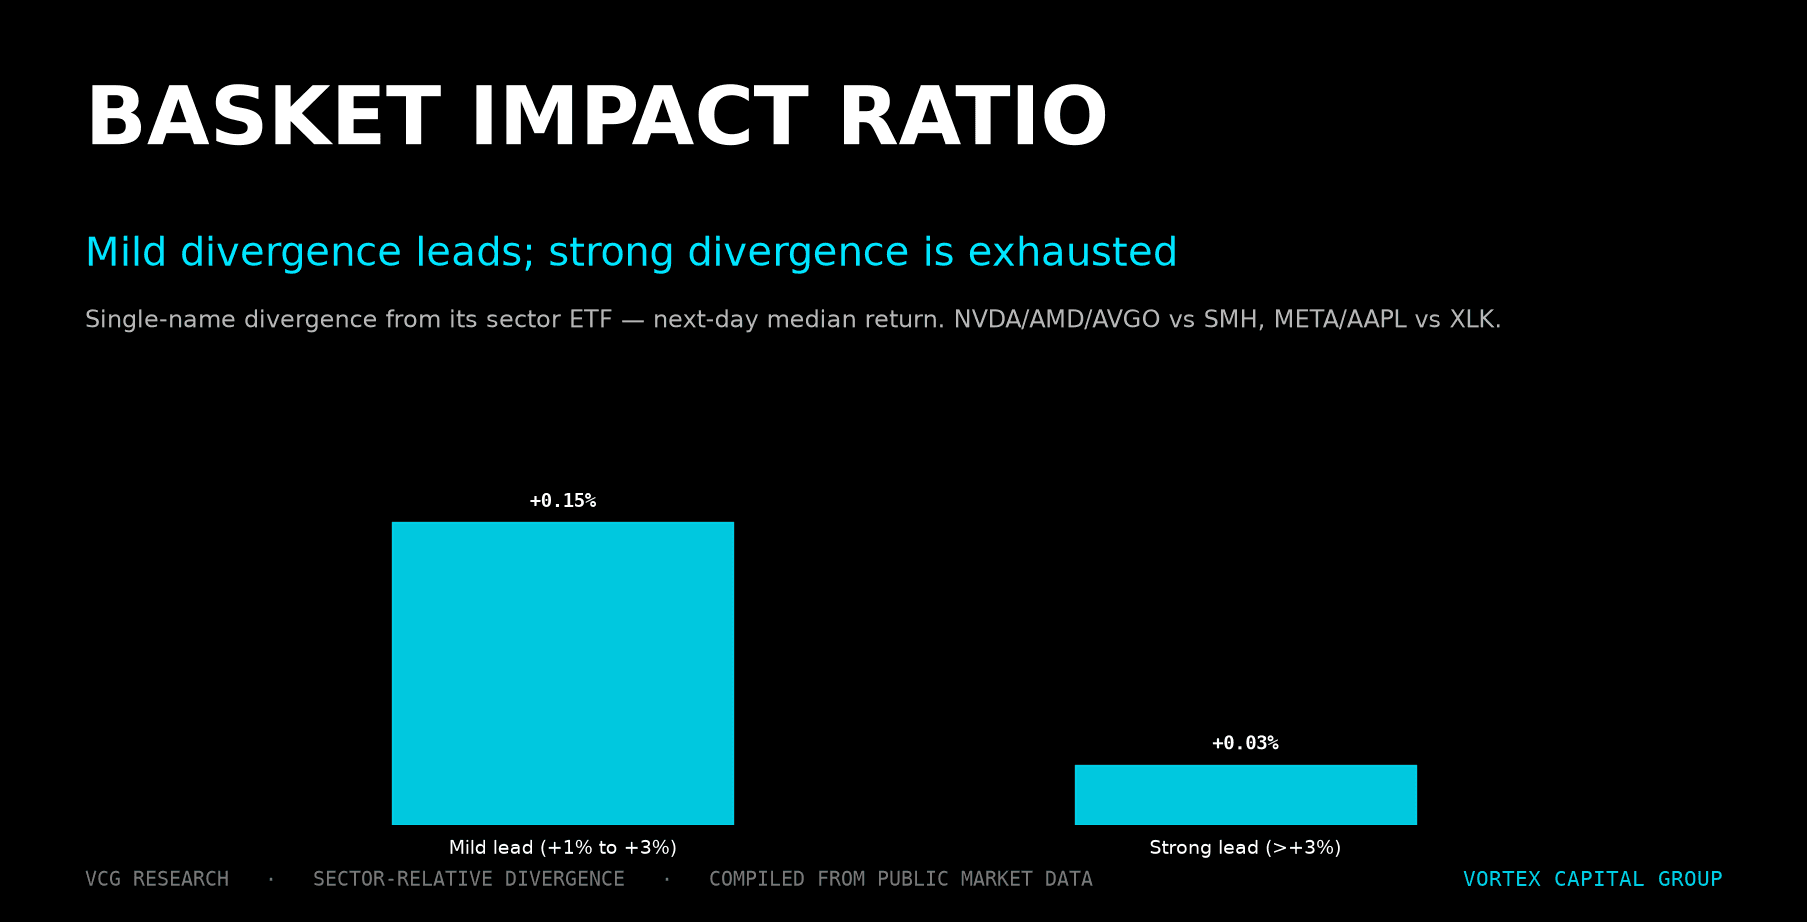
Basket Impact Ratio: A Better Tape Read for Sector Momentum Trades
Single-name divergence from sector ETF predicts next-day return non-linearly. Mild lead +0.15%, strong lead +0.03% - exhaustion shows up in the data, not just the chart.
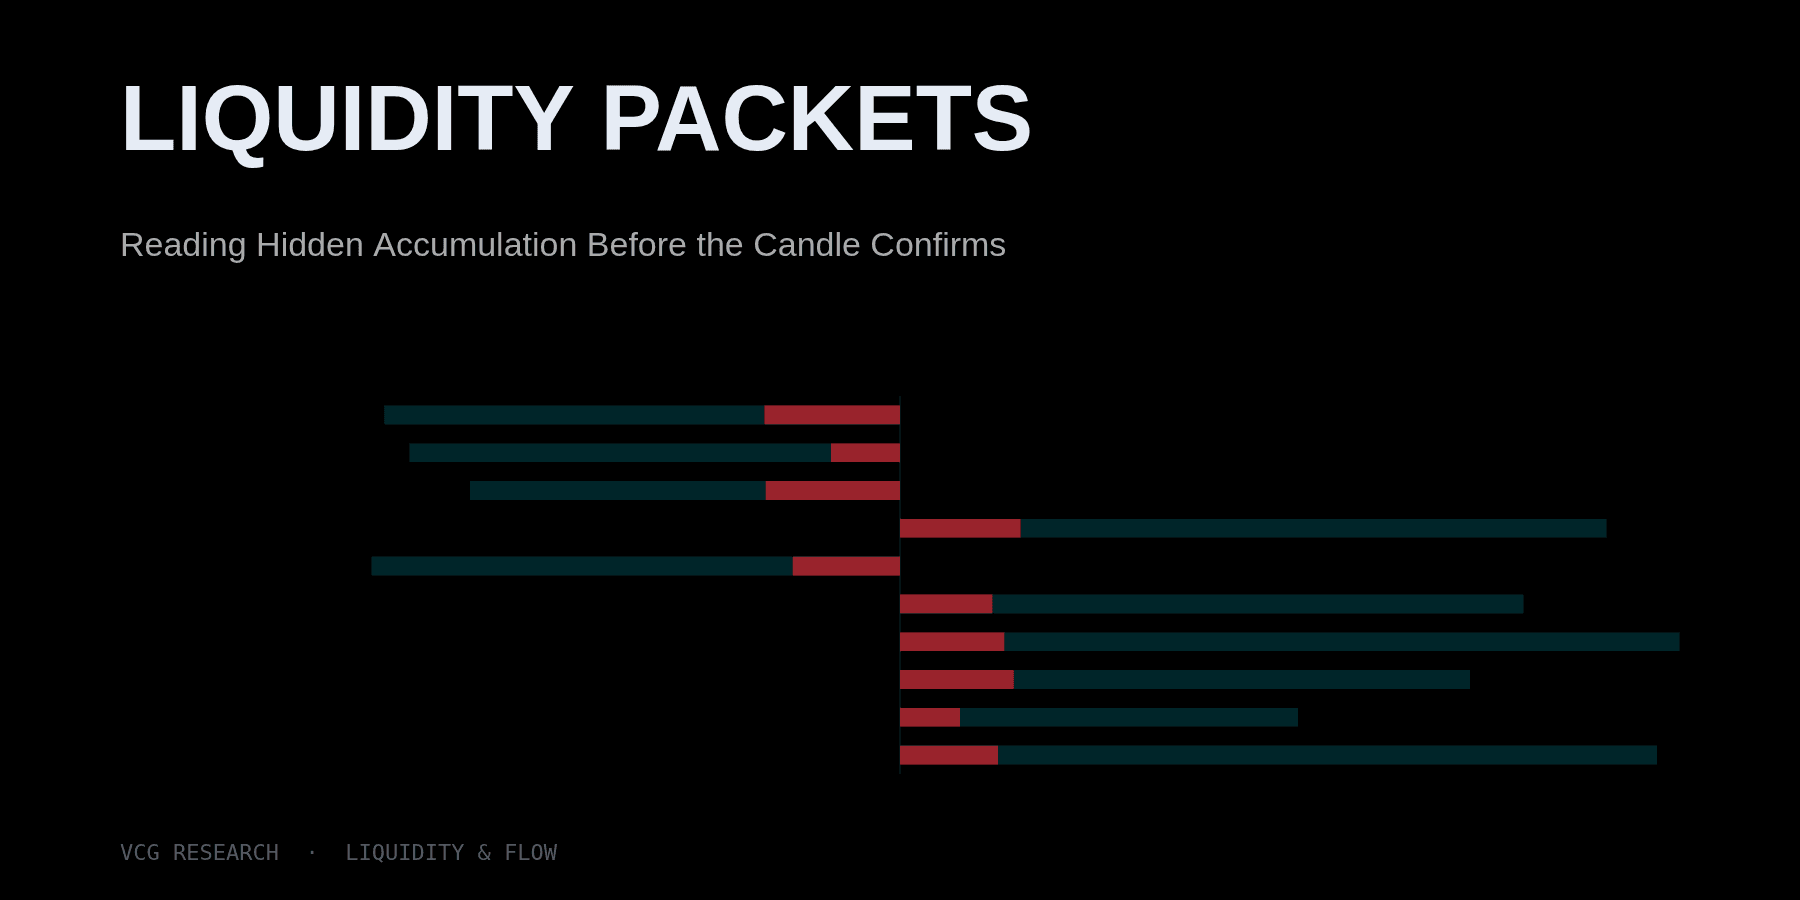
Liquidity Packets: Reading Hidden Accumulation Before the Candle Confirms
How prop traders read order-flow bursts as accumulation vs exhaustion before the chart confirms - CVD, refresh behavior, and trade-size distribution.
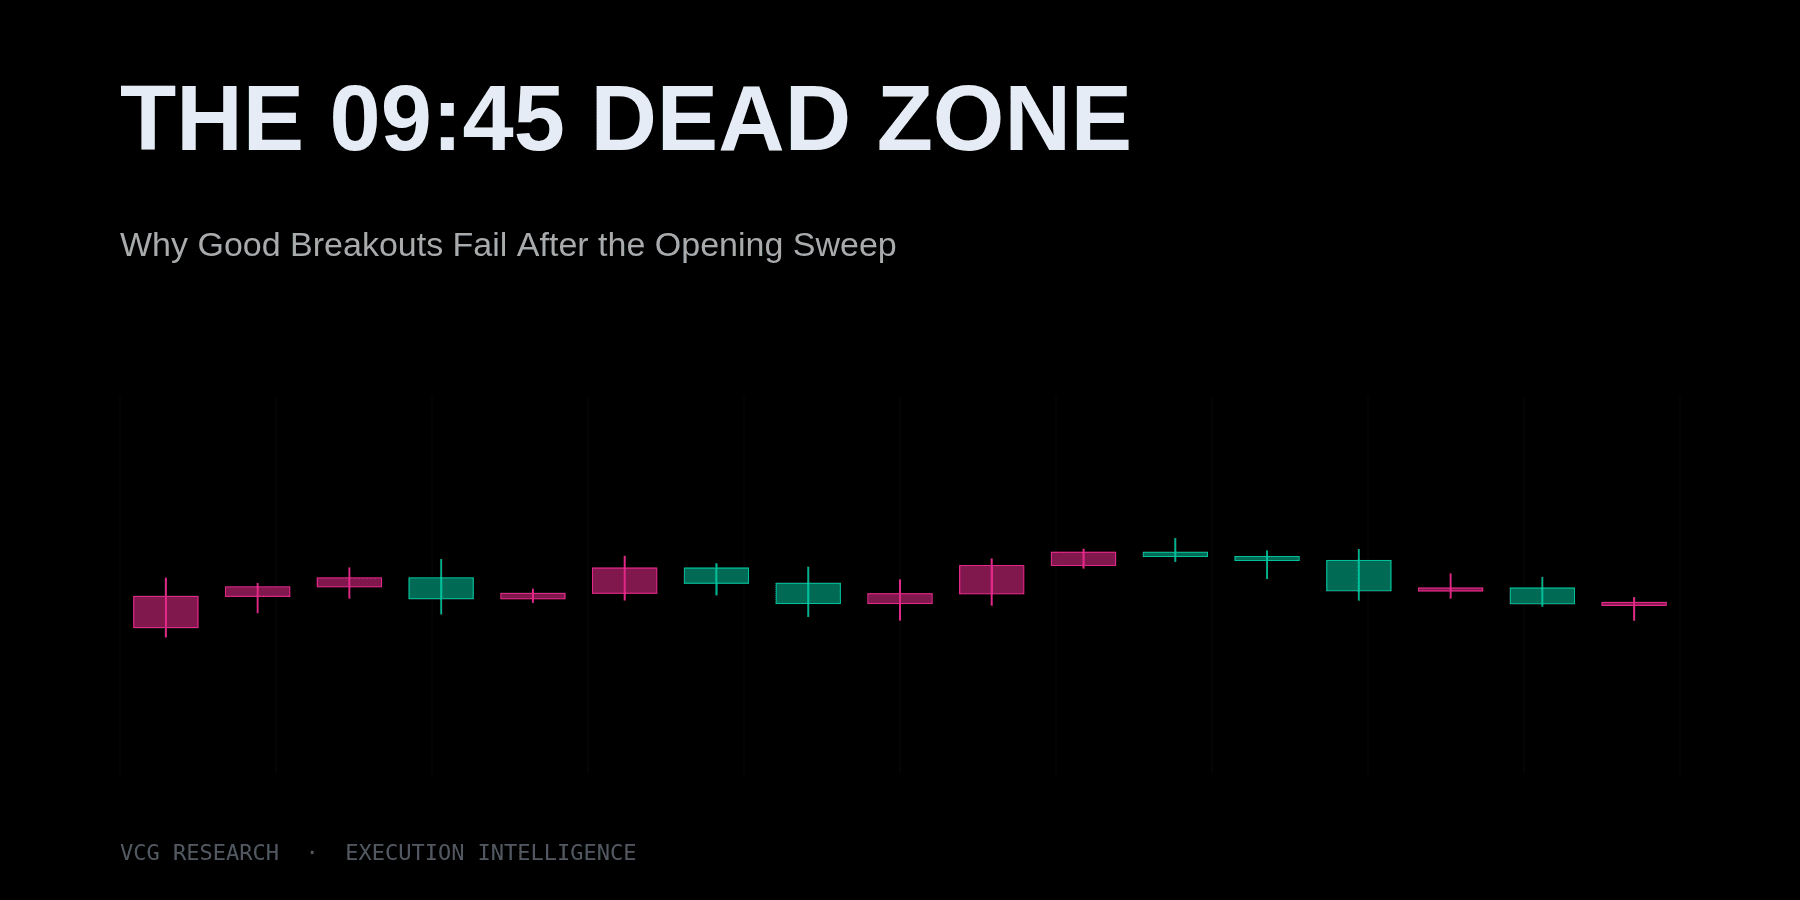
The 09:45 Dead Zone: Why Good Breakouts Fail After the Opening Sweep
The 09:45-10:15 ET window is where most ORB breakouts fail. Downside breaks reverse aggressively; upside breaks less reliably. Trade the failed retest.
International editions
Selected research published for our international trading community.
🇫🇷Français· 2
🇷🇺Русский· 2
🇰🇷한국어· 5
🇨🇳中文· 12
- 美股暗池数据怎么读:TRF 盘外成交与 FINRA ATS 报告的区别
- 你买的是中国,还是这家公司:单只中概股与 KWEB 的风险分解
- 一半的风险发生在美股收盘后:中概股隔夜与日内的方差分解
- 中概股跳空回补概率:醒来看到跳空,该不该反手
- 熬到几点,就拿到多少:亚洲交易员的美股时段账本
- 锚消失的122个交易日:A股休市期间,16只中概股会塌缩成1只
- 流动性梯度:7,725 次美股放量暴涨,和一条你看得见却拿不到的边际
- 看不见的涨停板:293个中概股"涨停日"的真实数据,和四个必须反过来用的A股直觉
- 离岸人民币(USD/CNH)隔夜走弱与中概股开盘跳空:7个真实案例的诚实解读
- 美股日内交易基础设施:中国交易员需要了解什么
- 暗池交易与机构订单流:主动交易员的结构性优势
- 沪深300到美股开盘的6小时窗口:中概股不是延续A股,而是反转A股