
10:30 VWAP Decision Point for Day Traders
TL;DR - We measured σ-distance from session VWAP at 10:30 ET - where σ is the standard deviation of price minus VWAP during the first hour - across 528 sessions on 8 mega-caps (Feb-May 2026), and tracked whether the session closed above or below VWAP. It is a real gauge, but a one-sided one. On the upside it works and strengthens with distance: +0.3σ to +2σ closes above VWAP ~60% of the time, >+2σ a full 72%. On the downside at 10:30 it is essentially a coin flip - and the tempting "moderate weakness reverts" idea does not survive the full sample (-2 to -1σ closes above 51% of the time, not the 70%+ a small sample once suggested). The downside signal only arrives later: as the day runs the probability cone tightens until σ-distance is near-deterministic - by 15:00, >+2σ closes above 98% of the time and <-2σ just 16%. Use 10:30 to trust strength, not to fade weakness.
Every active US day trader watches VWAP. The price above or below the session volume-weighted average is a textbook reference for trend bias, mean-reversion pressure and end-of-day flow. What most traders don't quantify is how far above or below - and what that distance, calibrated to the session's own volatility, actually says about where the close prints.
We built a single number, σ-distance from VWAP at 10:30 ET, and ran it across 8 mega-cap US names over 528 sessions. The result is a clean - if one-sided - single-checkpoint gauge for end-of-day side: at 10:30 it reads above-VWAP strength well and that edge grows with distance, while below-VWAP weakness stays close to a coin flip until the afternoon, when the probability cone finally tightens.
How we built the measurement
For each session and each of 8 mega-caps (SPY, QQQ, NVDA, TSLA, AMD, META, AAPL, AMZN), we computed:
- Session VWAP from 1-minute (High + Low + Close)/3 weighted by volume, accumulating from 09:30.
- σ for the day = standard deviation of (Close - VWAP) across the 09:30-10:30 window.
- σ-distance at 10:30 = (Close at 10:30 - VWAP at 10:30) / σ. This expresses "how far from VWAP" in units of that session's own dispersion.
- Outcome: did the session close above VWAP?
We then bucketed sessions by σ-distance into seven bands and computed the probability that the close finished above VWAP.
σ-distance at 10:30 reads the upside cleanly - and the downside barely at all
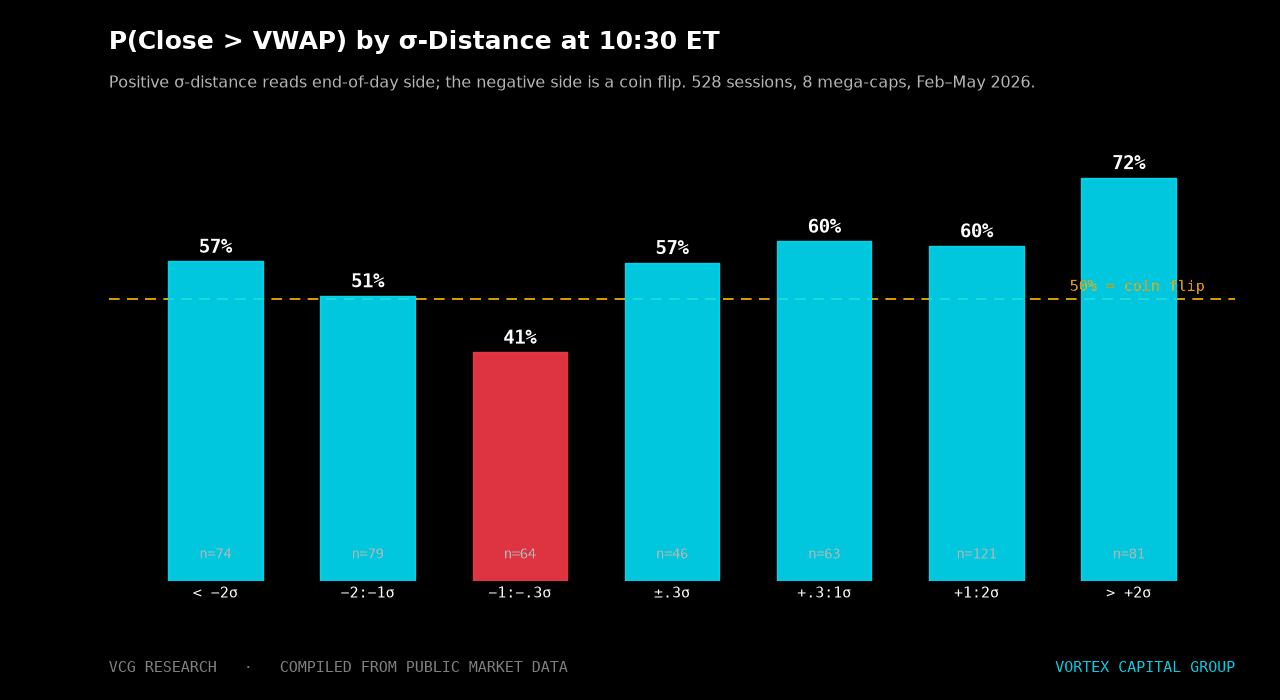
- > +2σ at 10:30: 72% of sessions close above VWAP (n=81). When a name is more than two session-σ above VWAP one hour into the session, betting against it from above is the wrong side.
- +1 to +2σ: 60% close above (n=121). A persistent above-VWAP reading - a real tilt that VWAP holds as support into the close.
- +0.3 to +1σ: 60% close above (n=63). Even a modest persistent positive σ-distance carries a measurable edge.
- ±0.3σ: 57% close above (n=46). Sitting on VWAP at 10:30 carries a faint upside lean - the structural intraday bid - but nothing you'd size to.
- -1 to -0.3σ: 41% close above (n=64). The only bucket with a genuine downside tilt at 10:30: a shallow dip below VWAP is the one that tends to stay below.
- -2 to -1σ: 51% close above (n=79). A coin flip. This is the bucket an earlier, much smaller sample had flagged at 71% above - a "moderate weakness reverts" paradox. On 528 sessions it isn't there. Moderate below-VWAP readings at 10:30 carry no edge in either direction.
- < -2σ: 57% close above (n=74). Strong sustained breakdowns at 10:30 do not cleanly continue or bounce - the instinct to fade two-σ weakness is, at 10:30, a coin flip with a faint upside lean.
The VWAP probability cone tightens through the day
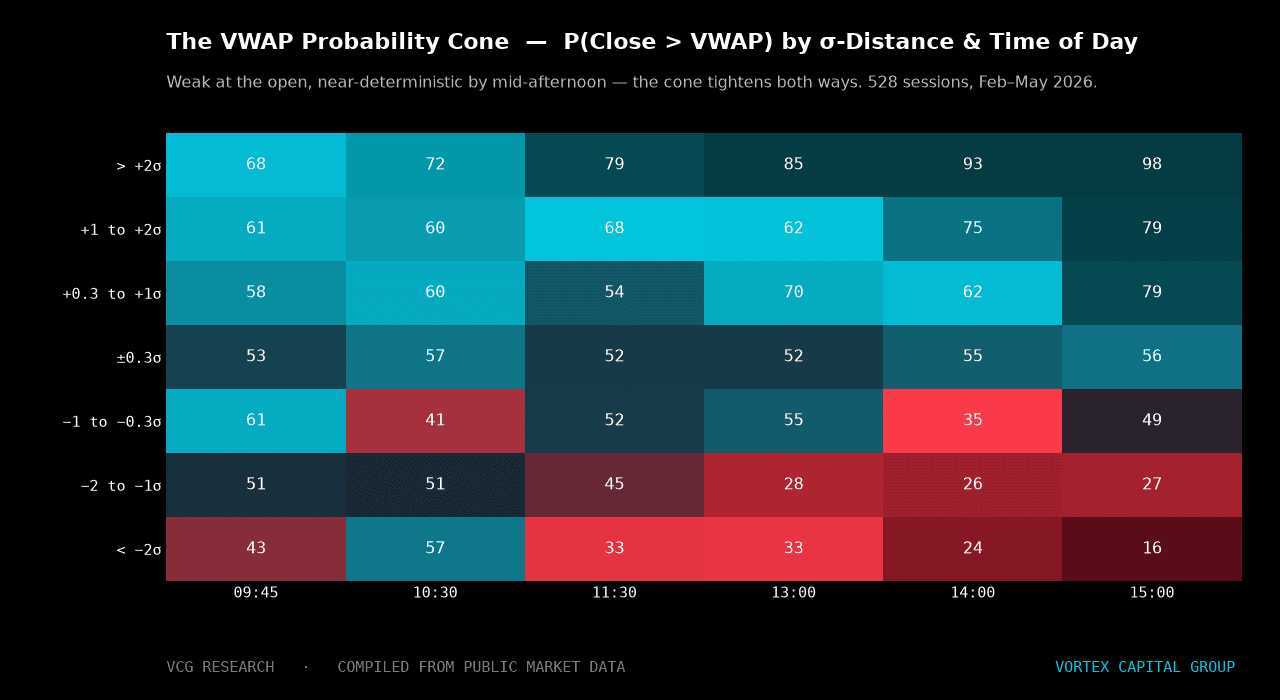
The heatmap above shows the same probability at checkpoints from 09:45 through 15:00. Two structures jump out. First, the cone tightens monotonically through the day: at 10:30 even the extremes are muted (>+2σ is 72%, <-2σ a coin-flip 57%), but by mid-afternoon σ-distance is near-deterministic - at 15:00, >+2σ closes above 98% of the time and <-2σ just 16%. Second, the asymmetry: the upside is readable from the open and only sharpens, while the downside carries essentially no morning edge and only becomes predictive after lunch. There is no morning mean-reversion signal hiding in the negative buckets - the cone simply hasn't closed yet.
Why σ-distance beats raw VWAP distance
Most VWAP-watching traders look at percentage distance from VWAP and react to it the same way regardless of which symbol they're trading. A 0.3% distance above VWAP means very different things in NVDA versus SPY: NVDA's intraday σ is roughly 4× SPY's. A 0.3% above VWAP in SPY is meaningful divergence; in NVDA it's noise.
σ-distance normalizes for this. A +1σ reading in NVDA and a +1σ reading in SPY carry approximately the same end-of-day probability, because each is calibrated to its own dispersion. This is what makes the cone tradable as a single number across symbols, regimes and volatility levels.
How we use the 10:30 decision point
We treat 10:30 as a decision checkpoint, not a trade trigger. When σ-distance at 10:30 is above +1σ, the upside bias is high enough to anchor existing longs and to disqualify counter-trend setups in the same name. We don't initiate "VWAP rejection short" trades against a name printing +2σ at 10:30 - the data says we'd be on the 28%-probability side.
We don't trade a morning "below-VWAP reversion" on base rate. The negative buckets at 10:30 don't reward it: -2 to -1σ is a coin flip (51% close above) and a shallow -1 to -0.3σ dip actually tends to stay below (41% reclaim). An earlier, much smaller sample once showed a 71% reversion edge here; the full 528-session set erases it. Any long into 10:30 weakness has to be justified by constructive order flow at the level - buy CVD turning, resting-bid absorption, no fresh seller initiative - not by a σ-distance edge that isn't there.
We exit losers before the cone tightens. If we're long a name and it's still at -1σ at 11:30 with no recovery momentum, the probability of a profitable VWAP reclaim only falls into the afternoon - by 15:00 a sub--2σ name closes above just 16% of the time. The cone closes. Our risk discipline is to exit before 13:00 if the σ-distance hasn't materially improved.
Confirmation is order flow, not price. Our Vortex Flow stack - CVD slope at the level, VWAP reclaim attempts on rising vs falling volume, dark-print clustering above or below VWAP - separates a probabilistic edge from a probabilistic trap. The 72% base rate above +2σ at 10:30 is what the data shows; whether to press the trend or trim into it is what the order flow tells us.
The takeaway
VWAP is the most-watched intraday reference on the active-trader screen, and it's also the most poorly used. Most traders react to the level; very few measure distance from it in σ-units. The 10:30 σ-distance reading is a single number with a measurable probability map, and the cone tightens cleanly through the day. We treat it as a decision checkpoint, not a signal - and the difference between those two postures is where the edge sits.
At Vortex Capital Group, we provide qualified traders with the intraday analytics, order-flow confirmation infrastructure, and DMA routing required to convert structural insights like the VWAP probability cone into consistent execution.
#VWAP #DayTrading #USEquities #IntradayTrading #OrderFlow #PropTrading #TechnicalAnalysis #NVDA #SPY #QQQ #DMA #VortexCapitalGroup
Trade with the desk behind the research
Vortex Capital Group gives qualified traders DMA via Sterling Trader Pro, multi-vendor HTB locates, smart and dark-pool routing, and an 80%+ monthly profit share.
Apply to Trade