
Reading US Dark-Pool Data: What the TRF Tape Shows, and What It Hides
TL;DR - Traders asking for "dark pool data" usually mean one of two different datasets, and conflating them produces confident nonsense. The consolidated tape marks every off-exchange print with exchange code D - the FINRA TRF - and that is available in real time. Across 14,462,464 trades and 696,830,308 shares in eight liquid names over three regular sessions (11-13 August 2026), 48.5% of volume and 61.2% of trades printed off exchange. But code D is not a dark-pool feed: it pools ATS executions with wholesaler internalization, and the internalization dominates. The tell is print size. Off-exchange prints are smaller than lit prints in every US megacap we measured - QQQ 0.52x, NVDA 0.54x, TSLA 0.63x, AAPL 0.65x, SPY 0.72x - and 90.2% of NVDA's off-exchange trades were under 100 shares against 75.3% on exchange. That is the retail odd-lot pipe, not a whale. The China ADRs break the pattern: BABA's off-exchange print is 1.07x its lit print, the only name in the sample where going off exchange means going bigger. FINRA's ATS file is the dataset that actually separates ATS from non-ATS, but it publishes two weeks late for Tier 1 NMS stocks and four weeks late for everything else - a structural map, never a signal.
Ask a search engine for US dark-pool data and you will get two answers that look interchangeable and are not. One is the consolidated tape, which flags off-exchange prints in real time. The other is FINRA's OTC Transparency file, which names the venues but arrives weeks late. Most of the confusion in retail discussion of dark pools comes from quoting a number sourced from the first and describing it as though it came from the second.
This post measures what the first one actually contains.
What exchange code D is, and what it is not
Every trade on the consolidated tape carries a reporting venue. Lit exchanges report under their own codes - P for NYSE Arca, Q for Nasdaq, K for Cboe EDGX, V for IEX, and so on. Everything executed away from an exchange reports to a FINRA Trade Reporting Facility and reaches the tape as exchange code D.
That single bucket contains two very different businesses:
- ATS executions - the dark pools proper. UBS ATS, MS Pool, Sigma X, IEX's non-displayed book, Level ATS and the rest.
- Wholesaler internalization - Citadel Securities, Virtu, Jane Street and the other retail market makers filling brokerage order flow against their own capital.
Nothing on the tape distinguishes them. So "48% of volume trades in dark pools" is wrong in the same way every time: the 48% is real, the label is not.
The measurement
Eight names, three consecutive regular sessions in a non-expiry week, every trade between 09:30 and 16:00 ET: SPY, QQQ, AAPL, NVDA, TSLA, plus BABA, PDD and NIO as a China-ADR cross-section. Fourteen and a half million trades.
| Symbol | Off-exchange % of volume | Off-exchange % of trades | Off ÷ lit print size |
|---|---|---|---|
| SPY | 42.5% | 50.5% | 0.72x |
| QQQ | 42.5% | 58.5% | 0.52x |
| AAPL | 47.2% | 58.0% | 0.65x |
| NVDA | 51.0% | 66.0% | 0.54x |
| TSLA | 54.9% | 65.7% | 0.63x |
| BABA | 45.1% | 43.3% | 1.07x |
| PDD | 41.5% | 43.3% | 0.93x |
| NIO | 50.9% | 52.7% | 0.93x |
Three things fall out of it.
1. The intraday shape is an arch, lowest at both bells
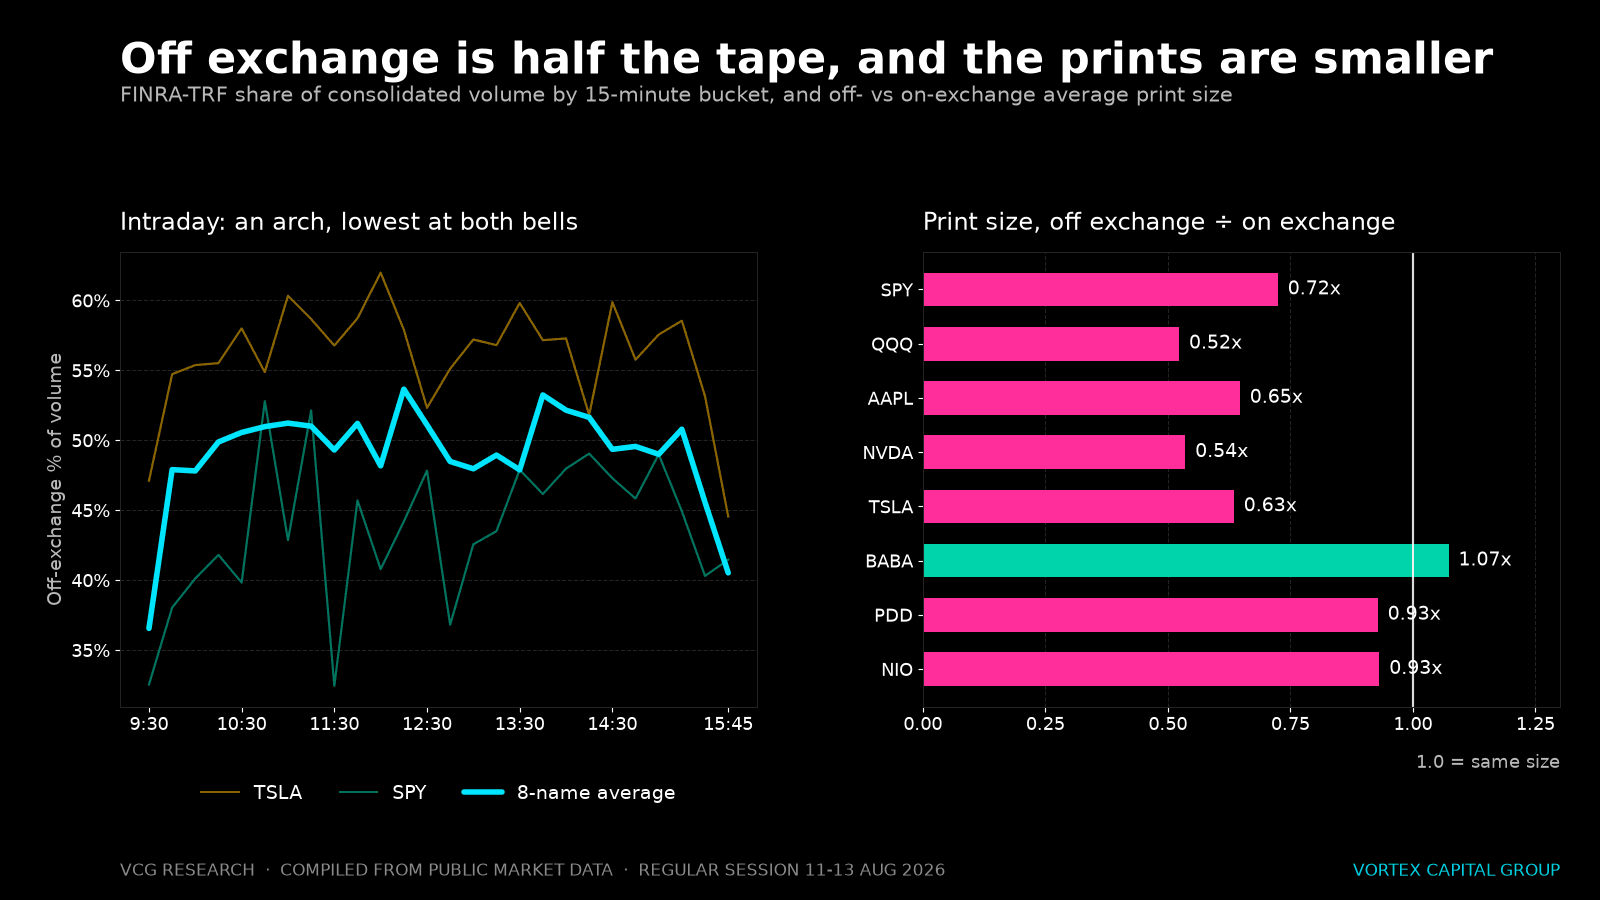
Pooled across all eight names, off-exchange share is 39.3% in the 09:30-09:45 bucket, climbs through the morning, runs 49.7%-55.6% between 11:30 and 14:00, and falls back to 39.2% in the 15:45-16:00 bucket.
The two ends are the two moments the lit book is deepest and the opening and closing auctions - both on-exchange mechanisms - are pulling volume. In the middle of the day the displayed book thins out, and a larger fraction of what trades gets crossed or internalized away from it. The practical read is the inverse of the folk version: the quiet midday tape is not the market going to sleep, it is the market moving off the screen you are watching.
This confirms, on measured data, the shape we described from industry estimates in 暗池交易与机构订单流 - the estimates had the midday peak at 44-45% against 30-32% at the bells, and the direction is right even where the level is not.
2. Off-exchange prints are smaller, which tells you who is doing them
This is the finding that should change how you read the number. If code D were mostly institutions working size in dark pools, the average off-exchange print would be larger than the lit print. It is consistently smaller:
- QQQ 0.52x, NVDA 0.54x, TSLA 0.63x, AAPL 0.65x, SPY 0.72x.
- 90.2% of NVDA's off-exchange trades were under 100 shares, against 75.3% of its on-exchange trades. For QQQ the split is 93.5% off exchange against 82.4% on.
Odd lots are the signature of retail flow being internalized one small order at a time. The dark pools are in there, but they are outnumbered. Anyone reading a high code-D percentage as evidence of institutional accumulation has the causality backwards - in the megacaps, a high off-exchange share is mostly a statement about how much retail flow the name attracts.
That is the same execution-quality gap we quantified in The PFOF Tax, viewed from the tape instead of from the fill.
3. The China ADRs invert it
BABA is the only name in the sample where the off-exchange print is larger than the lit print - 1.07x - with PDD and NIO at 0.93x, far closer to parity than any US megacap. The distribution says the same thing: 5.6% of BABA's off-exchange trades were 200-999 shares against 4.1% on exchange, and 0.7% were 1,000-5,000 shares against 0.2% on exchange.
The reasonable interpretation - and it is an interpretation, not a measurement - is mix. These names carry proportionally less US retail odd-lot flow than NVDA or TSLA, so genuine ATS and block activity is a bigger share of what remains off exchange. For anyone trading the China complex, it means code D is closer to being informative in BABA than it is in SPY, though still not clean.
What FINRA's ATS file adds, and what it costs you
FINRA's OTC Transparency data is the dataset that actually separates ATS volume from non-ATS off-exchange volume, per security, per venue, per week. It is the only public source that lets you say "this much traded in UBS ATS" rather than "this much traded off exchange."
The price is latency. FINRA publishes ATS and non-ATS weekly volume two weeks in arrears for Tier 1 NMS stocks, and four weeks in arrears for Tier 2 NMS stocks and OTC equities. By the time a week's venue breakdown is public, the tape has moved on fourteen to twenty-eight sessions.
That fixes what the file is good for. It is a structural map - which venues matter in which names, how concentrated the off-exchange flow is, whether a symbol's routing profile is changing over months. It is not, and cannot be, a trading signal. Any product selling you "dark pool prints" as a same-day edge is either selling you code D with a better name on it, or selling you inference.
What we do with it
Off-exchange share is a slow-moving property of a symbol, so we treat it as one. Across the three sessions SPY ran 43.1%, 42.1%, 42.3%; NVDA 50.6%, 51.1%, 51.3%. Those are stable enough to be a characteristic of the name rather than a daily variable. Thinner names are not - PDD printed 32.3%, 46.4%, 42.4% across the same three days, which is noise, not information.
So the usable version is: know each symbol's baseline, know that the lit book is thinnest exactly when off-exchange share is highest, and size and route accordingly. A midday order in a name that already crosses half its volume away from the exchange is competing for a displayed book that is smaller than the volume figures imply. That is a routing decision, and we walk through how we make it in Smart Routes vs Manual Routes and Dark Pool Liquidity.
Method and caveats
All trades in the consolidated (SIP) tape for the eight symbols, 09:30-16:00 ET, 11-13 August 2026 - deliberately a non-expiry week, since August 2026 monthly expiry fell on Friday the 21st. Off exchange is defined as reporting exchange code D (FINRA ADF/TRF); everything else is treated as on exchange. All trade conditions are included, odd lots among them, which is the point of the exercise rather than a flaw in it - but it does mean these percentages are not comparable to sources that filter to round lots or to consolidated-volume-eligible prints only. Three sessions is enough to show that the megacap numbers are stable and not enough to say anything about how they drift across a quarter.
Trade with the desk behind the research
Vortex Capital Group gives qualified traders DMA via Sterling Trader Pro, multi-vendor HTB locates, smart and dark-pool routing, and an 80%+ monthly profit share.
Apply to Trade