The Closing-Auction Magnet: What the Final 10 Minutes Actually Do
TL;DR - We measured whether the final 10 minutes (15:50→16:00 ET) extend the power-hour drift (15:00→15:50) across ~48 recent sessions per name. The "closing-auction magnet" is weaker and more name-specific than the folklore claims: SPY 53%, QQQ 56%, NVDA 61%, TSLA 54%, MSTR 48%, AMD 46% continuation - clustered around a coin flip. Median final-10-minute moves run 5-6 bps in the index ETFs but 12-22 bps in high-beta single names. The edge isn't "the close always trends." The edge is knowing which names carry a modest continuation tilt, how large the move actually is, and that you're trading into the widest spreads of the day.
The closing auction is the single largest liquidity event of the US session, and it has only grown as passive and index rebalancing flow concentrates into the 16:00 print. That has produced a popular belief that the last few minutes reliably accelerate the day's direction - the "magnet" into the close. We tested it on the tape instead of trusting the story.
What the final 10 minutes actually do
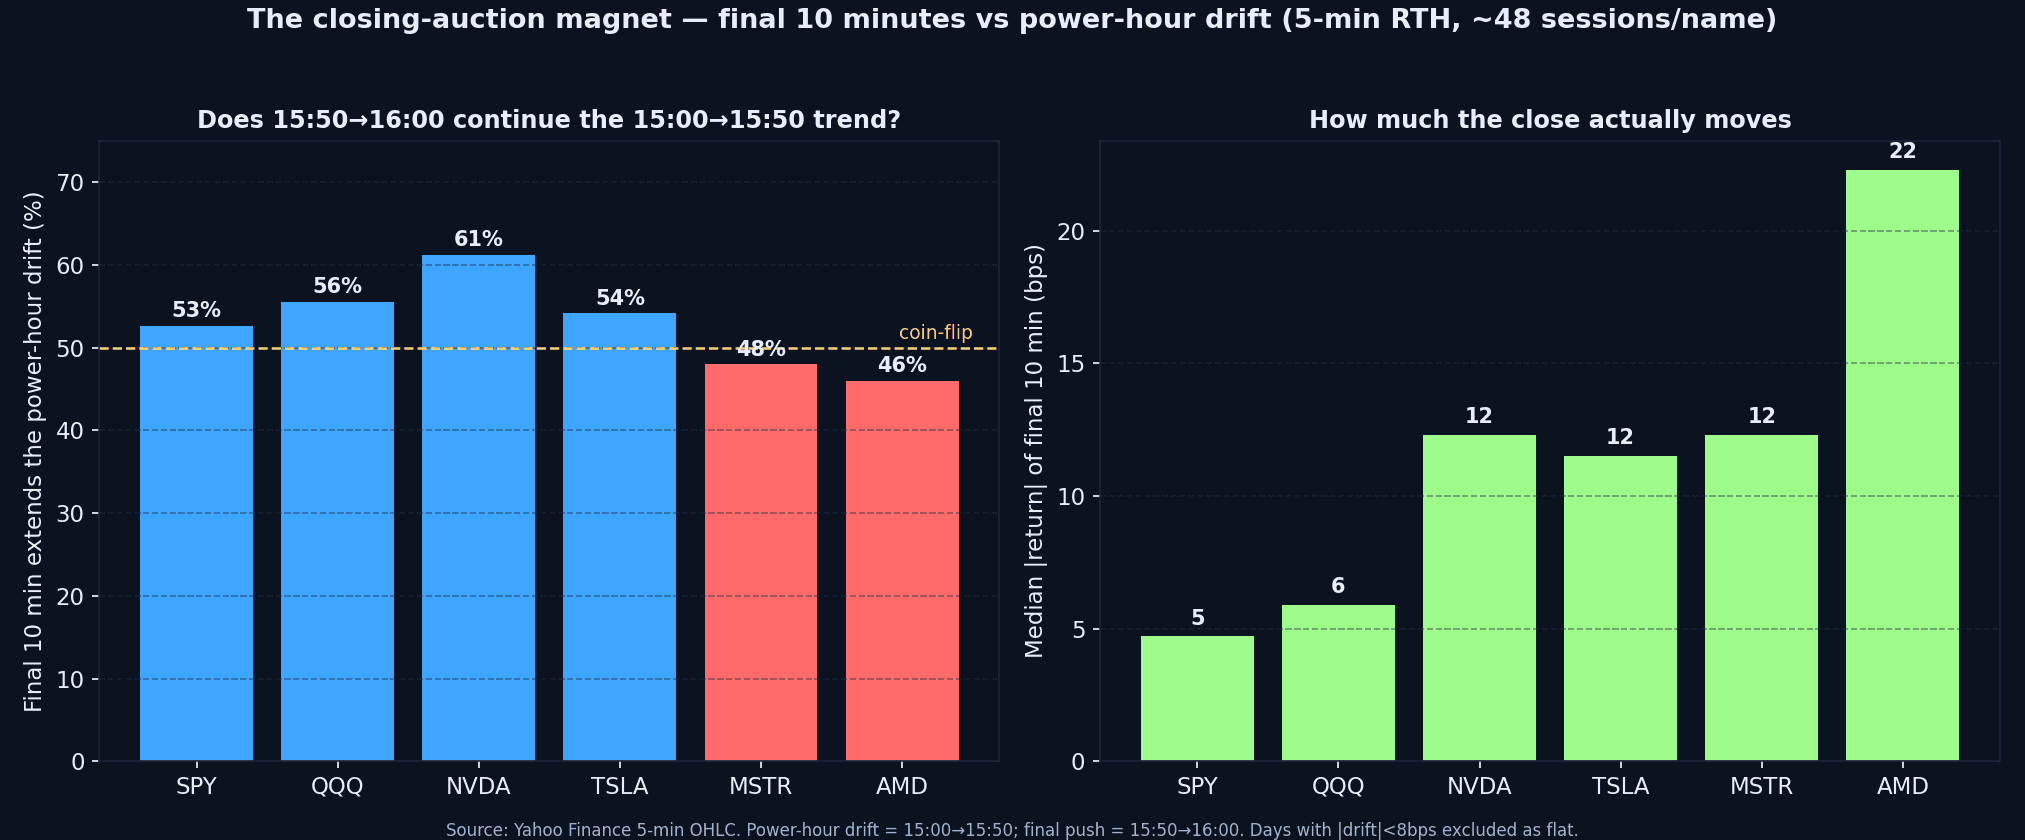
Using 5-minute regular-session bars over roughly the last 48 sessions per name, we defined the power-hour drift as the 15:00→15:50 return and the closing push as 15:50→16:00. Days with a negligible drift (under 8 bps) were excluded as flat. We then asked how often the final push extends the drift, and how big the final push is. Two findings:
- Continuation is close to a coin flip, not a magnet. Index ETFs and large-caps cluster at 53-56% (SPY 53%, QQQ 56%). NVDA is the standout at 61%; TSLA 54%. MSTR (48%) and AMD (46%) actually showed a mild tendency to fade the power-hour drift into the bell. A blanket "buy strength into the close" rule has no statistical home in this sample.
- Size scales with beta. The median absolute final-10-minute move was just 5-6 bps in SPY and QQQ, but 12 bps in NVDA, TSLA and MSTR, and 22 bps in AMD. The close is a small move in index products and a tradable move only in higher-beta single names - and only if execution cost doesn't eat it.
The honest read: there is a faint continuation tilt in index products and certain large-caps, no tilt-or-slight-fade in some high-beta names, and the absolute move is small enough that route quality decides whether the trade is even viable. "The close trends" is a regime-and-name statement, not a law.
Why the magnet is weaker than advertised
Two opposing forces meet in the last ten minutes. Market-on-close imbalance and index/passive demand can push price in the direction of the day's flow - the magnet. But liquidity providers and dispersion desks are simultaneously positioning against the imbalance, and a crowded power-hour drift is exactly the kind of move that attracts a closing fade. The net of those two forces is what produces the near-coin-flip continuation rate. When one name (NVDA) tilts higher, it usually reflects persistent same-direction index and options-hedging demand; when another (AMD) tilts to fade, it reflects exhaustion of the afternoon drive. This is the same exhaustion logic we cover in Volume Shock Without Sponsorship.
The cost trap nobody prices
Whatever directional edge exists in the close has to survive the worst spreads of the day. Displayed liquidity thins ahead of the auction even as volume concentrates into it, and marketable orders in the final minutes routinely cross wider books. A 12-bp expected move in NVDA is not a 12-bp trade if you pay 4-6 bps of spread and slippage to get in and out. This is precisely where the PFOF Tax compounds - the closing window is the highest-cost-per-trade environment of the session - and where dark and midpoint routing can be worth the wait when footprint matters more than immediacy.
The desk framework for the close
- Name first, direction second. Only trade closing continuation in names that have shown the tilt and the move size to justify it. The index ETFs rarely move enough; the fade-prone names need a different playbook.
- Confirm the drift is real before 15:50. A drift built on genuine afternoon participation is more likely to extend than one built on a single late imbalance print. The 10:30 VWAP Decision Point framework - acceptance vs a single touch - applies to the afternoon too.
- Write the route before the trigger. Decide urgent, passive, midpoint or no-trade before 15:50, because there's no time to deliberate inside the final bars. The Smart Routes vs Manual Routes framework is the reference.
- Measure exit slippage, not just the candle. A winning closing trade with a sloppy fill is still an execution problem. Implementation shortfall on closing trades is where most of the theoretical edge quietly disappears.
The close is the bookend to the open, and our session-structure research treats them as one arc - see The 09:30-09:45 Auction, The 9:45 Dead Zone and The Lunch Reversal Window. The same discipline - measure the edge, size to the move, respect the cost - runs end to end.
Related reads
The 09:30-09:45 Auction · The Lunch Reversal Window · The 10:30 VWAP Decision Point · The PFOF Tax · Dark Pool Liquidity.
Join the desk
If you trade the close because you've measured which names actually carry the tilt - and you route to keep the spread from eating it - that's the kind of process we want to review. The trader application takes about ten minutes; serious applicants receive a response within five business days.
#ClosingAuction #MOC #PowerHour #DayTrading #MarketMicrostructure #ExecutionQuality #OrderFlow #Liquidity #PropTrading #VortexCapitalGroup
Trade with the desk behind the research
Vortex Capital Group gives qualified traders DMA via Sterling Trader Pro, multi-vendor HTB locates, smart and dark-pool routing, and an 80%+ monthly profit share.
Apply to Trade