
One Claim, Two Prices: The Dual-Class Arb Is Real, and It Costs Almost Exactly What It Pays
TL;DR - Twelve US issuers list two classes of common stock with the same per-share cash claim and different votes. That makes the spread between them the rarest thing in equities: a relative-value trade with no forecast in it. The evidence that it reverts is unambiguous. Pooled over the seven liquid equal-claim pairs, a deviation from the 60-session mean predicts the next ten sessions of spread change with a slope of -0.122 (t -13.35, n 7,714), and the decile sort is monotone - D1 minus D10 is +49.1 bps over ten sessions. Every liquid pair is negative. The placebos - GOOGL/MSFT, GOOGL/SPY, and best of all FOXA/NWSA, two Murdoch-controlled media issuers with identical class structures and no shared claim - are flat: slopes of -0.01, -0.01 and -0.00, t-stats inside ±0.6. The one pair whose dividends are not equal, Greif, is the only one with a positive slope. Intraday, the dislocation is born in the opening auction and decays all morning: signal at 09:32 and enter one minute later and 10.3 bps per standard deviation comes back by 15:55 (t -6.22); wait until 11:00 and it is 4.4; at 15:00 it is 1.2 and no longer significant. Both sides pay, symmetrically - short the rich class +17.7 bps (t 4.26), buy the cheap class +17.2 bps (t 3.71) - so this is not a borrow artefact. Then costs decide. Round-trip the NBBO on both legs and only two of six survive: GOOGL/GOOG +3.3 bps net and NWSA/NWS +7.5 bps. HEICO, the fattest gross edge in the study at 49.7 bps, costs 124.0 bps to take. Across the cross-section the gross edge correlates +0.95 with the round-trip cost. The arb is real, it is priced, and it is a rebate for supplying immediacy across two order books - not a rent you collect by crossing spreads. One warning attached: the single most statistically impressive result in the whole study, Moog at a 10-session slope of -0.87 (t -27.66) and 485 bps a trade, is entirely an artefact of a leg that prints zero times in a median session.
Most "arbitrage" in equities is a forecast wearing a costume. You are long one thing and short another because you believe something about earnings, or flows, or a factor, and the hedge makes the belief cheaper to hold. It is a view, not an arb.
Dual-class shares are the exception. When one issuer lists two classes of common stock that receive the identical per-share dividend and represent the identical claim on liquidation, the only differences priced into the spread are governance and liquidity. There is no forecast. If the two prices move apart for reasons unrelated to either, something has to give.
This is a study of whether anything actually does.
The set-up, and the check that comes first
Twelve US issuers list two classes with both legs on the SIP tape and enough volume to be worth measuring. Daily bars are raw - unadjusted - for a reason that matters: both classes receive the same cash dividend on the same ex-date, but a vendor's dividend adjustment factor is 1 - div/close, and the two closes differ. An adjusted series injects a slow drift into the ratio that looks exactly like a trend. Every number here uses raw prices. The ratio series were scanned for split jumps; there are none in the window on any liquid pair.
Then the check that decides what the article is even allowed to claim. Dividend parity was verified per leg from the dividend record, not assumed. Eleven of the twelve pairs pay identical per-share amounts on identical ex-dates across 2024-2026, or pay nothing on either class. One does not:
Greif Class B receives 1.5x the Class A dividend - $0.93 against $0.62 for the quarter with a 17 September 2026 ex-date, and the same 1.50 ratio on every quarter back to 2024. GEF/GEF.B is not an equal-claim pair and nothing in the arbitrage argument applies to it. It stays in the study as a control, and it earns its place.
The verified class terms, from the issuers' own disclosure:
| Issuer | Ticker 1 | Ticker 2 | Terms | Claim |
|---|---|---|---|---|
| Alphabet | GOOGL | GOOG | Class A, 1 vote / Class C, none | equal |
| Fox | FOXA | FOX | Class A, no vote* / Class B, 1 vote | equal |
| News Corp | NWSA | NWS | Class A, no vote* / Class B, 1 vote | equal |
| Under Armour | UAA | UA | Class A, 1 vote / Class C, none | equal |
| Zillow | ZG | Z | Class A, 1 vote / Class C, none | equal |
| Lennar | LEN | LEN.B | Class A, 1 vote / Class B, 10 votes | equal |
| HEICO | HEI | HEI.A | common, 1 vote / Class A, 1/10 vote | equal |
| Brown-Forman | BF.A | BF.B | Class A voting / Class B non-voting | equal |
| Crawford | CRD.A | CRD.B | Class A non-voting / Class B voting | equal |
| Rush Enterprises | RUSHA | RUSHB | Class A, 1/20 vote / Class B, 1 vote | equal |
| Moog | MOG.A | MOG.B | Class A, 1/10 vote / Class B, 1 vote, B converts 1:1 into A | equal |
| Greif | GEF | GEF.B | Class A / Class B | B gets 1.5x the dividend |
* Fox and News Corp Class A vote only in limited circumstances - mergers, and while a declared dividend is unpaid.
Finding 1: the level is a price, not an error
The first thing to get out of the way is that the size of the gap is not the opportunity. Voting rights are worth something, liquidity is worth something, and the market has an opinion about both. On 3 September 2026:
| Pair | Close 1 | Close 2 | Premium now | 4-yr median | 2022 median | 2026 median |
|---|---|---|---|---|---|---|
| HEICO HEI / HEI.A | 325.70 | 239.26 | +36.1% | +26.5% | +23.9% | +33.2% |
| Fox FOXA / FOX | 67.71 | 60.47 | +12.0% | +8.4% | +8.1% | +11.3% |
| Zillow ZG / Z | 36.04 | 35.34 | +2.0% | -2.1% | -1.0% | +0.2% |
| Lennar LEN / LEN.B | 84.45 | 82.84 | +1.9% | +8.4% | +20.9% | +2.5% |
| Under Armour UAA / UA | 5.19 | 5.10 | +1.8% | +6.5% | +12.1% | +2.7% |
| Brown-Forman BF.A / BF.B | 27.92 | 27.51 | +1.5% | +0.7% | -3.5% | +1.7% |
| Alphabet GOOGL / GOOG | 342.48 | 339.08 | +1.0% | -0.6% | -0.4% | +0.5% |
| News Corp NWSA / NWS | 30.95 | 34.72 | -10.9% | -3.8% | -1.4% | -12.3% |
| Greif GEF / GEF.B | 85.02 | 107.62 | -21.0% | -5.5% | +1.0% | -19.6% |
Two things in that table are worth pausing on.
The first is HEICO. The Class A shares carry a tenth of a vote and trade 26.5% below the common - the widest governance discount in this set, and it has been widening, not closing. Nothing in this article says that gap should close. It is a price.
The second is the pair of Murdoch companies, because they set the sign in opposite directions. At Fox the non-voting Class A trades 12.0% above the voting Class B. At News Corp the voting Class B trades 10.9% above the non-voting Class A. Same controlling family, same class architecture, opposite conclusion about what a vote is worth. There is no single mechanism setting the sign of a voting premium, which is a useful thing to know before you assume one.
Finding 2: the deviation is the trade, and the identical claim is what makes it one
Take the log ratio of the two closes in basis points, and define the deviation as the distance from its own trailing 60-session mean. Regress the next ten sessions of spread change on today's deviation. A slope of -1.00 would mean the deviation is fully worked off by that horizon.
| Pair | 1 session | 5 | 10 | 20 |
|---|---|---|---|---|
| GOOGL / GOOG | -0.12 (t -7.9) | -0.24 (-10.3) | -0.33 (-11.8) | -0.43 (-13.0) |
| NWSA / NWS | -0.03 (-3.2) | -0.10 (-5.0) | -0.20 (-7.3) | -0.20 (-5.9) |
| HEI / HEI.A | -0.06 (-4.9) | -0.12 (-6.1) | -0.18 (-7.2) | -0.21 (-6.7) |
| BF.A / BF.B | -0.06 (-4.8) | -0.10 (-5.2) | -0.17 (-6.9) | -0.29 (-8.8) |
| ZG / Z | -0.03 (-3.2) | -0.08 (-4.2) | -0.12 (-5.0) | -0.18 (-5.7) |
| UAA / UA | -0.05 (-4.4) | -0.08 (-4.2) | -0.09 (-3.9) | -0.07 (-2.4) |
| FOXA / FOX | -0.03 (-2.8) | -0.06 (-3.3) | -0.09 (-3.8) | -0.15 (-4.8) |
| Pooled | -0.042 (-10.5) | -0.080 (-11.6) | -0.122 (-13.4) | -0.143 (-12.1) |
| GEF / GEF.B (unequal claim) | -0.00 (-0.6) | +0.01 (+0.9) | +0.05 (+2.5) | +0.10 (+3.4) |
Overlapping windows inflate those t-statistics; dividing by √k gives a conservative pooled -4.22 at ten sessions on 7,714 observations. It survives comfortably.
The decile sort on the pooled liquid set is monotone at the ends and clean in the middle:
| Decile | Mean deviation (sd) | Forward 10-session change | t |
|---|---|---|---|
| 1 (most negative) | -1.79 | +27.8 bps | 6.71 |
| 2 | -0.97 | +9.8 | 3.02 |
| 5 | -0.07 | -0.5 | -0.15 |
| 9 | +1.03 | -8.5 | -2.57 |
| 10 (most positive) | +1.83 | -21.1 bps | -6.04 |
D1 minus D10 is +49.1 bps over ten sessions, t 9.03 raw and 2.86 after the overlap haircut.
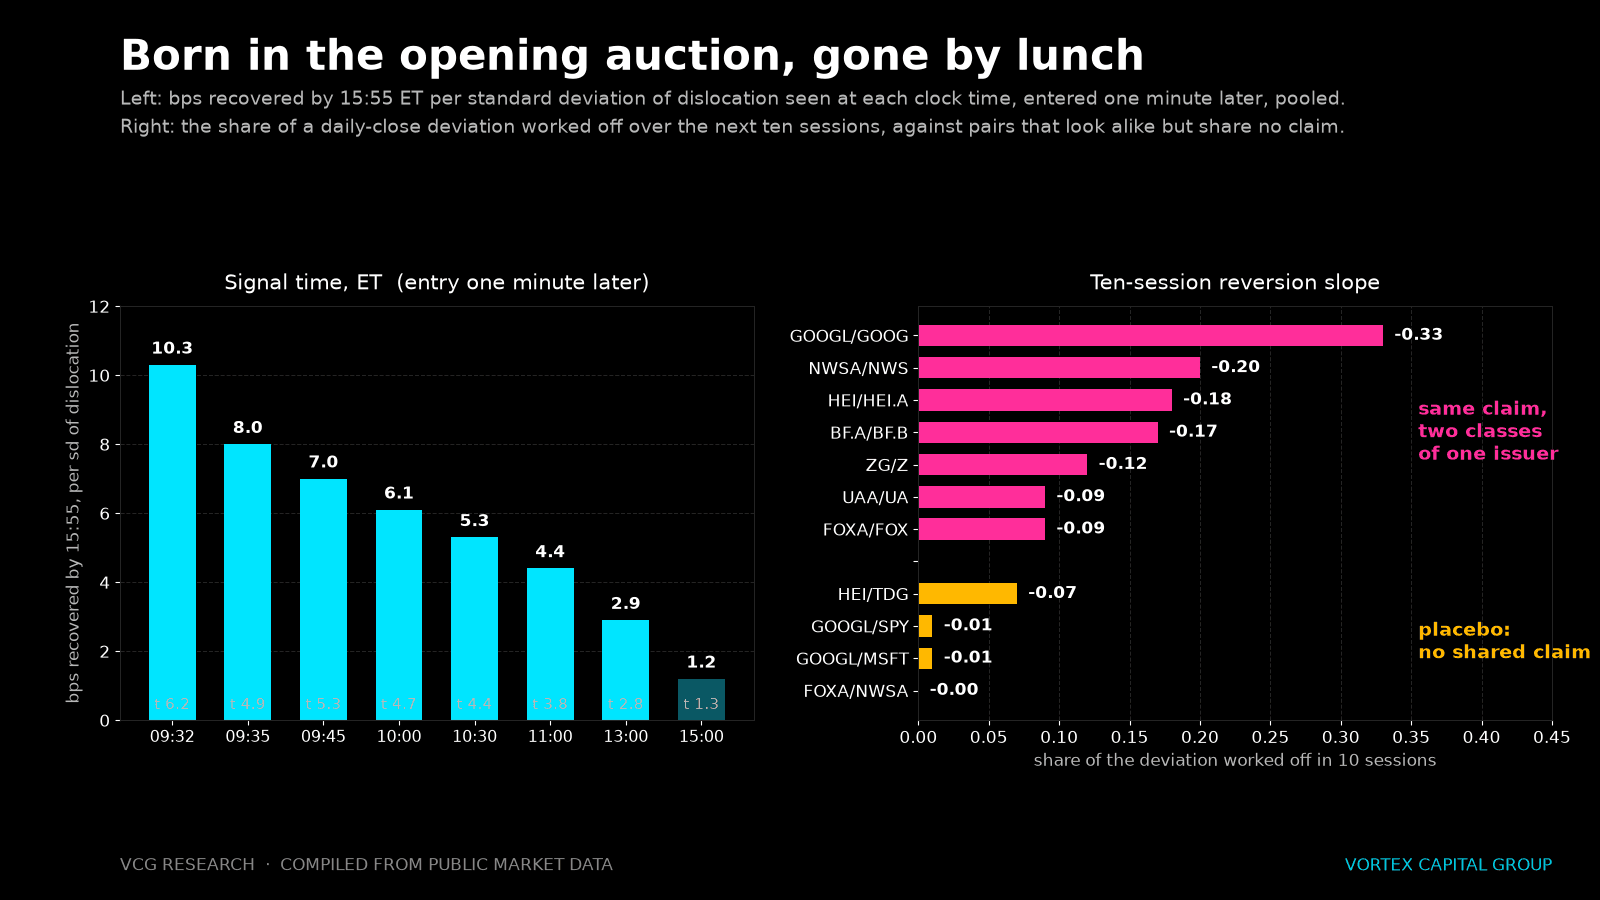
Now the part that makes this an arbitrage claim rather than a pairs-trading claim. Run the identical test on pairs that look similar but do not share a claim:
| Pair | 10-session slope | t | sd of deviation |
|---|---|---|---|
| GOOGL / GOOG (same claim) | -0.33 | -11.77 | 28 bps |
| HEI / HEI.A (same claim) | -0.18 | -7.17 | 113 bps |
| FOXA / FOX (same claim) | -0.09 | -3.80 | 93 bps |
| HEI / TDG - two aerospace aftermarket compounders | -0.07 | -3.24 | 591 bps |
| GOOGL / SPY | -0.01 | -0.56 | 4,117 bps |
| GOOGL / MSFT | -0.01 | -0.28 | 4,149 bps |
| FOXA / NWSA - two Murdoch media issuers, same class architecture | -0.00 | -0.09 | 799 bps |
FOXA/NWSA is the one to look at. Same family, same controlling structure, same industry, same dual-class architecture, listed on the same exchange - and the deviation does not revert at all. What separates it from FOXA/FOX is one thing only: FOXA and FOX are claims on the same cash flows and FOXA and NWSA are not.
Look at the last column too. Alphabet's two classes have a deviation standard deviation of 28 basis points. GOOGL against MSFT is 4,149 - 148 times noisier. The shared claim is not merely producing the reversion; it is collapsing the residual variance that makes the reversion measurable in the first place.
Finding 3: the dislocation is born in the opening auction
The two classes cross in separate opening auctions, with independent imbalances and independent participants. There is no mechanism forcing the two crosses to agree. So the open should print them out of line, and the day session should repair it.
It does. Take the dislocation at each clock time against a 20-session anchor, enter one minute later - requiring an actual trade to print on both legs at the entry minute, so the entry price can never be the print that generated the signal - and hold to 15:55:
| Signal | Entry | bps recovered by 15:55 per sd | t | n |
|---|---|---|---|---|
| 09:32 | 09:33 | 10.3 | -6.22 | 631 |
| 09:35 | 09:36 | 8.0 | -4.91 | 638 |
| 09:45 | 09:46 | 7.0 | -5.30 | 718 |
| 10:00 | 10:01 | 6.1 | -4.70 | 662 |
| 10:30 | 10:31 | 5.3 | -4.38 | 663 |
| 11:00 | 11:01 | 4.4 | -3.77 | 678 |
| 13:00 | 13:01 | 2.9 | -2.84 | 638 |
| 15:00 | 15:01 | 1.2 | -1.32 | 753 |
Monotone decay from the opening minutes to statistical nothing by mid-afternoon. Bid-ask bounce cannot produce that shape - bounce is a one-tick artefact that would sit at the same size at every clock time - and it cannot survive the execution delay, which is why the delay is there. Measured at the 09:32 print rather than a minute later, the number is 22.1 rather than 10.3; roughly half of the raw opening figure is bounce, and the honest figure is the delayed one.
It is stable across the sample: -12.1 bps/sd (t -4.86) over 2 March to 5 June, -8.7 (t -3.96) over 5 June to 3 September.
And it pays on both sides, which matters:
- Short the class trading rich at 09:32: +17.7 bps to the bell, t 4.26, n 119.
- Buy the class trading cheap: +17.2 bps, t 3.71, n 92.
Symmetry rules out the usual explanations. A short-side-only result would point at borrow; a long-side-only result would point at retail flow. This is neither.
Finding 4: the best-looking statistics in the study are fake
Moog produces the most impressive numbers on this page by a wide margin. A ten-session reversion slope of -0.87 with a t-statistic of -27.66. A daily z-score backtest returning 485.1 bps a trade in-sample (t 7.68) and 497.8 out-of-sample (t 2.84), winning 91% and 88% of the time. Crawford is the same story on a smaller scale: slope -0.28, t -10.39, half-life 4.0 sessions.
Both are worthless, and for the same reason.
MOG.B's median daily trade count is zero. Not low - zero. It does not print on a typical session. CRD.B trades about 118 times a day and $48,000 of stock. When one leg is stale, the "spread" is a measurement of how long ago that leg last traded, and its "reversion" is that leg eventually catching up. There is no position that harvests it.
Moog is the sharpest illustration available, because the pair has a genuine hard bound: MOG.B converts one-for-one into MOG.A at the holder's option, so MOG.B can never be worth less than MOG.A. On 3 September the closes were MOG.B $368.03 against MOG.A $370.12 - the bound violated by 0.6% on the tape. It is not a violation. It is a stale print on a leg with a 274 bps quoted spread and 126 bps at the open on the other side. The bound holds in the quotes; the tape just cannot see it.
This is the same failure that killed the illiquid ETF iNAV trade and the same one behind the 62-session mirage. Any relative-value study run on trade prices without a same-minute liveness filter on both legs will find its strongest result in whichever instrument trades least.
Finding 5: two of them do not revert at all, and one goes the wrong way
Stationarity on the level, Dickey-Fuller t on the full 1,172 sessions - below -2.86 rejects a unit root at 5%:
| Pair | DF t | Half-life | Verdict |
|---|---|---|---|
| GOOGL / GOOG | -4.52 | 4.5 d | stationary |
| HEI / HEI.A | -4.04 | 8.4 d | stationary |
| BF.A / BF.B | -3.52 | 8.5 d | stationary |
| ZG / Z | -3.22 | 12.9 d | stationary |
| UAA / UA | -3.10 | 8.9 d | stationary |
| FOXA / FOX | -2.77 | 14.0 d | marginal |
| LEN / LEN.B | -1.41 | 14.4 d | no |
| NWSA / NWS | -1.29 | 12.3 d | no |
| GEF / GEF.B | -1.32 | 22.3 d | unequal claim |
News Corp's voting premium went from 1.4% in 2022 to 12.3% in 2026. Lennar's Class B discount went from 20.9% to 2.5%. Those are four-year repricings, not oscillations. A trader fading the rich class in News Corp on the reasoning in Finding 2 would have been on the wrong side of a nine-point structural move for four years. The deviation from a 60-day mean still reverts in both - that is what Finding 2 measures - but the level does not, so anything anchored to a long-run average is a slow loss.
And Greif, the unequal-claim control, is the only pair in the study with a positive forward slope: +0.05 at ten sessions (t 2.49), +0.10 at twenty (t 3.40). It trends. When the claims differ, the pair behaves like two different securities - which is exactly what it is.
Finding 6: the edge is almost exactly the fee
Everything above is gross. Here is the gate.
The trade fires at 09:33, so the entry crosses the opening spread; the exit at 15:55 crosses a mid-session spread. The NBBO was rebuilt from the SIP quote tape - Alpaca returns each venue's updates, not the consolidated best, so every venue's last quote is carried forward and max(bid) / min(ask) taken - and sampled across five sessions in late August and early September.
Round-trip cost of the pair = (open₁ + open₂)/2 + (mid₁ + mid₂)/2, in bps of gross notional.
| Pair | Gross, |z| ≥ 1 | t | n | Entry cost | Exit cost | Round trip | Net |
|---|---|---|---|---|---|---|---|
| GOOGL / GOOG | 4.6 | 1.65 | 55 | 0.7 | 0.6 | 1.3 | +3.3 |
| NWSA / NWS | 15.3 | 2.48 | 41 | 4.7 | 3.1 | 7.8 | +7.5 |
| FOXA / FOX | 25.8 | 3.01 | 27 | 22.6 | 3.6 | 26.1 | -0.3 |
| ZG / Z | 16.5 | 1.58 | 33 | 17.3 | 6.8 | 24.1 | -7.6 |
| UAA / UA | 17.4 | 3.17 | 36 | 19.7 | 19.7 | 39.4 | -22.0 |
| HEI / HEI.A | 49.7 | 2.88 | 19 | 106.1 | 17.9 | 124.0 | -74.3 |
| Pooled gross | +17.5 | 5.66 | 211 |
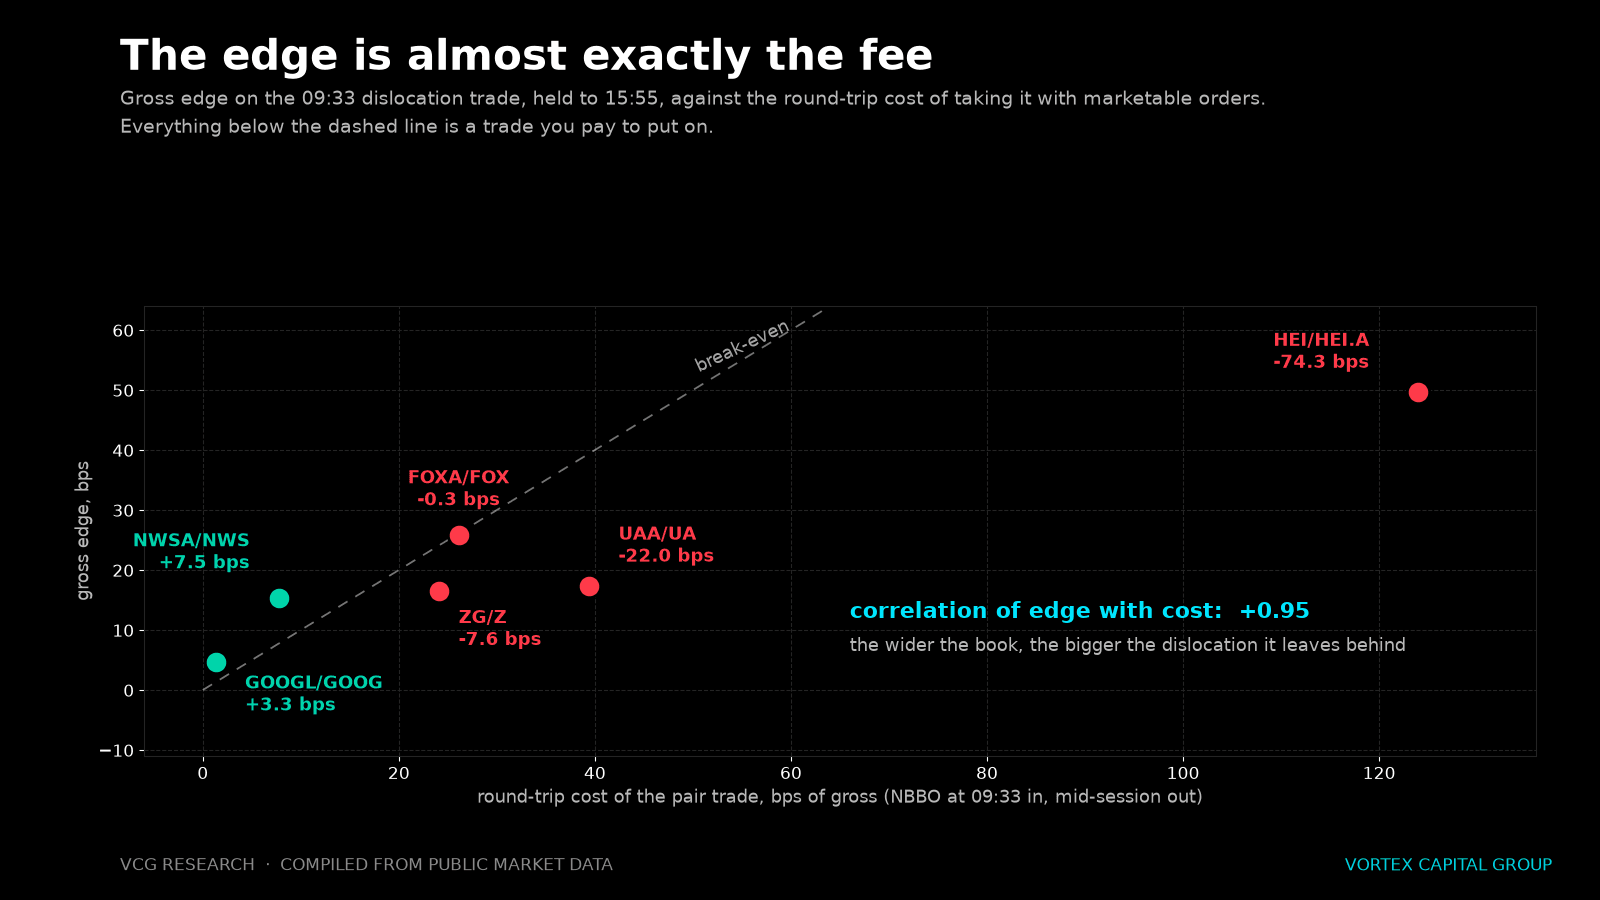
Two of six survive as a taker, and they are the two with the tightest books - Alphabet's legs quote at 0.6 and 0.9 bps at 09:33, News Corp's at 6.5 and 3.0. HEICO, which offers the fattest gross edge in the entire study at 49.7 bps, quotes 155.6 bps on the Class A in the opening minutes. You cannot get there from here.
That is not a coincidence, and it is the finding worth taking away:
Across the six pairs, the gross edge correlates +0.95 with the round-trip cost (Spearman +0.94; +0.67 excluding HEICO). The fitted line is gross = 9.5 + 0.325 × cost.
The wider the book, the bigger the dislocation the opening auction leaves behind - and the dislocation grows at about a third the rate the spread does, so it never catches up. The dual-class dislocation is not a rent sitting in the market. It is the price of immediacy, and it is set at roughly what immediacy costs. You capture it by supplying liquidity into the imbalance, not by crossing the spread to correct it.
Finding 7: the multi-day version is thinner than it looks
The obvious response is to trade the same signal over the multi-day horizon, where you can enter mid-session and pay tight spreads on both sides.
Signal on the daily close, execute at the next close, hold ten sessions, non-overlapping so each trade is an independent observation, in-sample 2022-2024 and out-of-sample 2025 to 3 September 2026:
| |z| threshold | In-sample | Out-of-sample | All | Cost-adjusted survivors |
|---|---|---|---|---|
| 1.5 | +2.2 bps, t 0.44, n 233 | +23.7 bps, t 2.32, n 132 | +10.0 bps, t 2.02, n 365 | NWSA/NWS +21.0, ZG/Z +9.9, GOOGL/GOOG +4.5 |
| 2.0 | +0.5 bps, t 0.08, n 145 | +7.8 bps, t 0.61, n 80 | +3.1 bps, t 0.51, n 225 | - |
At the standard threshold it clears zero and not much else. No individual pair is significant on its own (Alphabet t 1.47, News Corp t 1.52, Zillow t 2.00 across the full sample), and leave-one-pair-out takes the pooled t between 1.46 and 2.26 - no single pair carries it, but no single pair can be removed without it going soft either. At a tighter threshold it disappears. The out-of-sample half being four times the in-sample half is not a reason to celebrate; it is mostly News Corp's spread stabilising after a four-year repricing, and that is regime, not edge.
The multi-day trade is real in the panel and marginal in the account. The intraday trade is where the mechanism actually is.
A live observation, offered as an observation
Alphabet's voting premium changed sign in 2026. GOOG - the non-voting Class C - traded above GOOGL on median in every year from 2022 through 2025. In 2026 the median flipped to +0.5% in favour of GOOGL, and on 3 September GOOGL closed at $342.48 against GOOG at $339.08, a +1.0% premium and the widest reading in the 1,172-session sample. The dividends are identical - $0.22 per share, same ex-date - so nothing about the claim changed.
Candidate mechanisms exist. None of them is verified here, and we are not asserting one. What can be said is narrower and more useful: this is a level change, the 60-day mean has already caught up to it, so the deviation is small and there is nothing to trade in it today. The thing worth watching is whether the new level holds - because a pair that flips sign and stays flipped is a News Corp, not a mean reversion.
What we would actually take from this
- Alpha does exist, and it is smaller and better hidden than the pitch decks say. Seven pairs, seven negative slopes, four placebos that do nothing, and an unequal-claim control that goes the other way. That is a clean demonstration that the market leaves real, mechanical dislocations in US equities. It is also, at 10.3 bps per standard deviation, a demonstration of how much of one it leaves.
- Post, do not cross. The whole result lives on the correlation in Finding 6. If you take liquidity you pay roughly what the dislocation is worth. The trade is only a trade if you are the one supplying immediacy at 09:33.
- Verify the claim before you call anything an arb. Greif's Class B receives 1.5x the dividend. That single fact converts an apparent 21% mispricing into a rational price and turns a reversion trade into a trend. One dividend query, one minute, and it changes the sign of everything downstream.
- Filter both legs for liveness on the same bar, always. The most statistically compelling result on this page - t of -27.66, 485 bps a trade, 91% win rate - is a stale print. Any pairs study without that filter will find its best result in its worst instrument.
- The level is not the trade, and the trend is not your friend. HEICO's 26.5% Class A discount and News Corp's 12.3% voting premium are prices. Both have widened for four years. Fading a level because it looks wide is how a mean-reversion trade turns into a directional bet on governance.
We looked at what the first fifteen minutes actually pay in the 09:30-09:45 auction, at the same cost gate killing a different opening trade in the opening-print mirage, at what a stale consolidated quote costs in the SIP lag, and at how thin the visible book really is in liquidity is a clock. Anyone intending to run the short leg of this on HEI.A, FOX, NWS, LEN.B or BF.A should read hard-to-borrow mechanics first.
Method and caveats
US price data is Alpaca consolidated (SIP), raw / unadjusted, 3 January 2022 to 3 September 2026, 1,172 sessions per symbol. Intraday work uses SIP one-minute bars from 2 March to 3 September 2026 and requires a non-zero trade count on both legs in the same minute; entries additionally require a print at the entry minute itself, with no carry-forward. Dividend records per leg are from EODHD and were checked ex-date by ex-date; class terms are from the issuers' own disclosure, not inferred from ticker convention.
Spreads were sampled, not measured continuously: five sessions in late August and early September 2026, one-minute windows at 09:33-09:36 and at 10:30 / 12:00 / 14:30 ET, with the first half of each window used only to populate the book. Applying a September cost estimate to earlier periods is optimistic, since spreads were wider. GOOGL and NWS returned few usable windows because of quote volume and sparsity respectively, so those two cost figures rest on less data than the others.
Borrow is assumed free and available. Every trade here is half short, and on the thin legs - HEI.A, FOX, NWS, LEN.B, BF.A - that is a real assumption that biases the results favourably. We could not verify locate availability or rate from this data set and did not try to. Nothing in the symmetry of Finding 3 rescues you from a borrow you cannot get.
Sample sizes are named where they matter and are small in places: 19 sessions for the HEICO gate, 27 for Fox, 47 clean strict-entry sessions for HEICO against 130 for Alphabet. The intraday work is one six-month window and 631 pooled observations - one regime, not a law. The multi-day panel spans 2022-2026 with an explicit 2022-2024 / 2025-2026 split; the decile sort and the panel regressions are in-sample across the full period, and the non-overlapping backtest in Finding 7 is the only genuinely out-of-sample exercise. Overlapping-window t-statistics are reported raw and with a √k haircut; take the haircut.
Brown-Forman and Lennar appear in the level and stationarity work but drop out of the strict-entry intraday sample - BF.A and LEN.B do not print reliably at a named minute, which is itself the finding from Section 4 applied to them. Moog, Crawford and Rush Enterprises are shown as controls and are not tradeable at any size we would put on.
Trade with the desk behind the research
Vortex Capital Group gives qualified traders DMA via Sterling Trader Pro, multi-vendor HTB locates, smart and dark-pool routing, and an 80%+ monthly profit share.
Apply to Trade