The Halt Tripwire: LULD Band Math, Velocity Bursts, and Trading the Reopen
TL;DR - Across 535 five-minute velocity bursts in nine halt-prone names over 60 sessions, mid-size bursts (2.5-4%) continue 56% of the time with a +39bp median 30-minute follow-through, while band-stress bursts (≥4%) reverse 65% of the time. The probability of another burst within 30 minutes climbs monotonically from 33% to 94% as burst size grows. The LULD band is the only intraday level enforced by regulation rather than opinion - and price behaves differently as it approaches.
Every active trader has watched a name halt. The tape freezes mid-print, Level 2 grays out, and for five minutes the most liquid market in the world simply stops. Most traders treat halts as random hazards - weather events that happen to them. They are not. A Limit Up-Limit Down halt is the visible end of a mechanical process that starts several percent earlier, runs on published arithmetic, and leaves footprints in the tape the entire way in.
We call the zone where that process becomes tradable the halt tripwire - and the data says the trade changes sign as you approach it.
The band math most traders never compute
- Reference price. LULD computes the arithmetic mean of eligible trades over the preceding five minutes, refreshed every 30 seconds when it has drifted at least 1%. Your “fast move” is being measured against a five-minute trailing anchor - the same window as the velocity bursts we study below.
- Bands. Tier 1 names (S&P 500, Russell 1000, select ETPs) trade inside ±5% bands; Tier 2 - which includes most of the high-short-interest momentum universe - gets ±10%; stocks priced $0.75-$3.00 get ±20%. Bands are doubled in the opening and closing windows.
- Limit state → pause. When the national best offer touches the lower band or the best bid touches the upper band, the stock enters a 15-second limit state. If it doesn't resolve, trading pauses for five minutes and the primary exchange runs a reopening auction - extendable in five-minute increments while an imbalance persists.
- The SSR overlay. A 10% intraday decline from the prior close trips Rule 201, restricting short sales to prices above the national best bid for the rest of that day and the entire next day. Many of the same bursts that threaten the band also trip the SSR - two regime changes from one move.
For a Tier 2 name, a 4% five-minute bar consumes roughly 40% of the distance to a trading halt in a single print window. That is what we mean by band stress - and it is measurable without any special feed.
How we measured it
For nine halt-prone, high-short-interest names (GME, AMC, CVNA, UPST, MARA, RIOT, SMCI, BYND, TLRY) plus three liquid controls (SPY, NVDA, TSLA), we took 60 sessions of regular-hours 5-minute bars and computed:
- Velocity burst = any bar-to-bar close change of at least 1.5%, bucketed into 1.5-2.5%, 2.5-4%, and ≥4%.
- Forward behavior = the 15-minute and 30-minute returns after the burst bar, signed in the burst direction. Same sign = continuation; opposite = reversal.
- Cluster flag = true if another ≥1.5% burst printed within the following 30 minutes.
One honest caveat: standard market data does not carry halt flags, so velocity bursts are a proxy for band stress, not a halt event study. The proxy is conservative - every LULD halt begins as exactly this kind of bar.
Mid-size bursts continue. Band-stress bursts reverse.
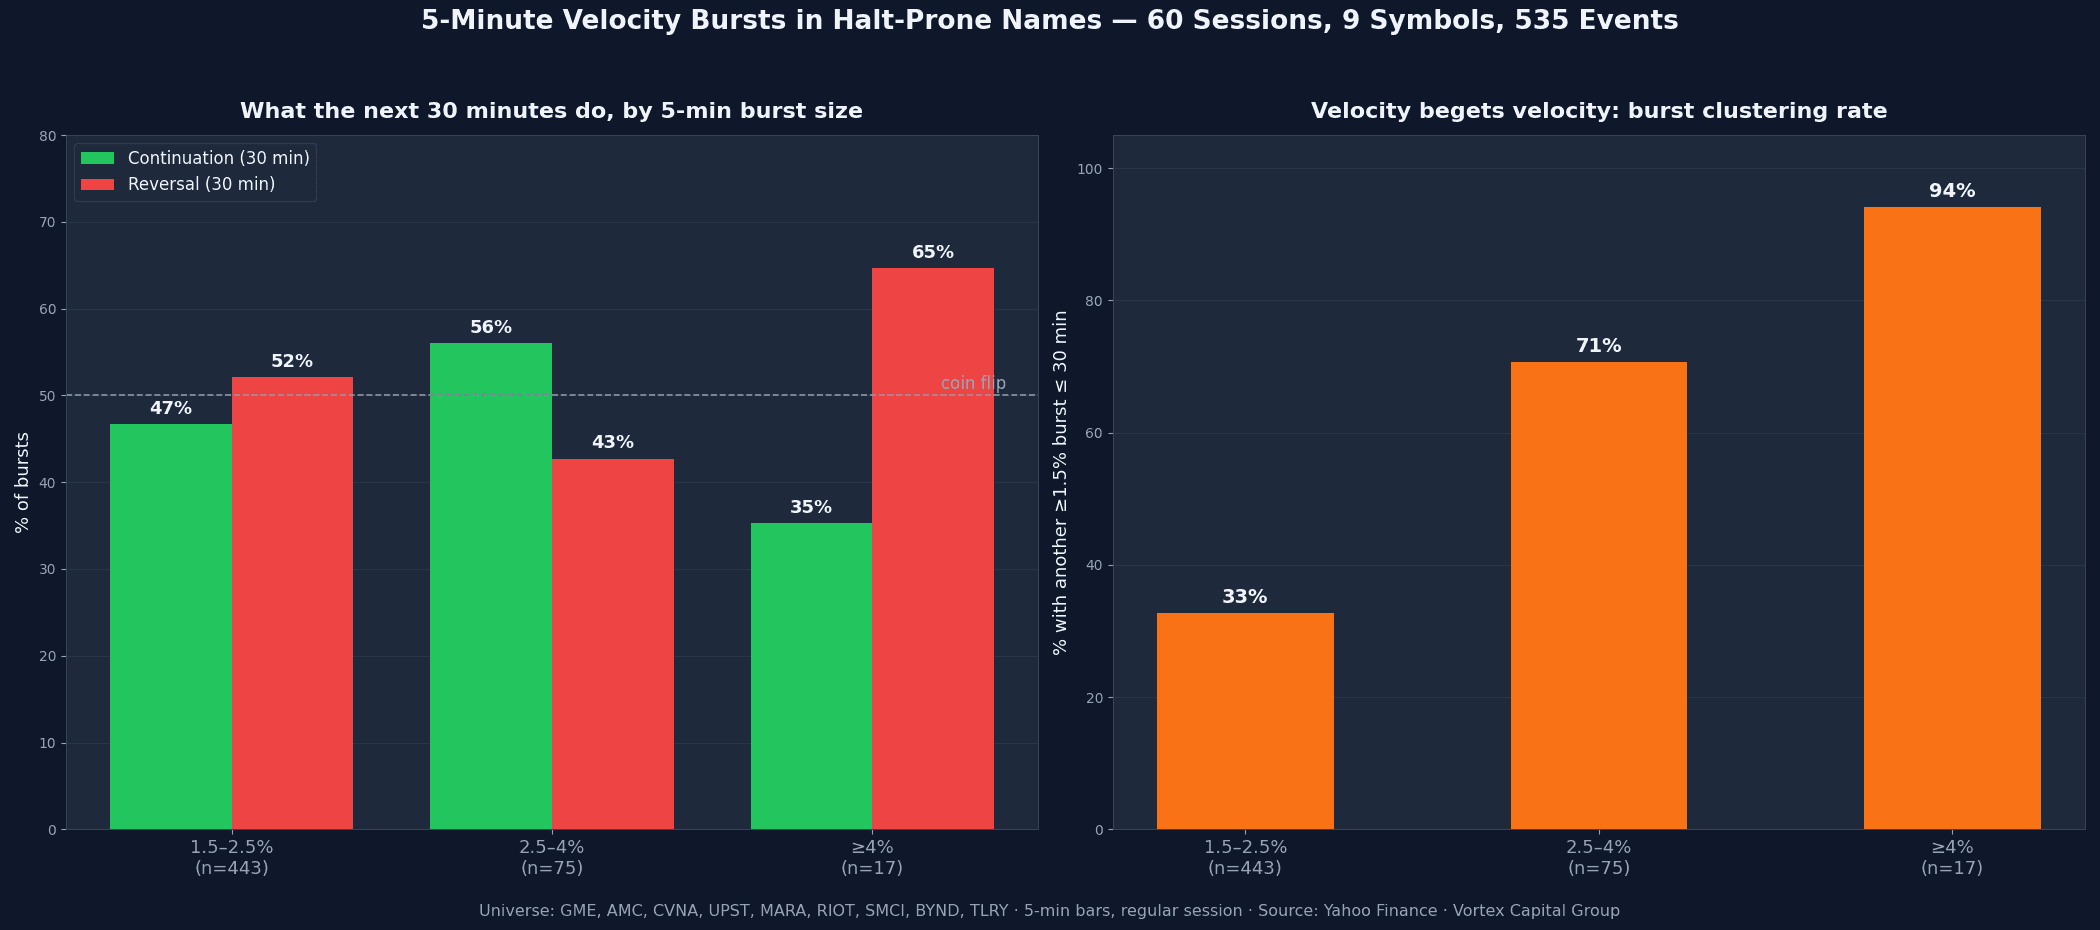
- 1.5-2.5% bursts (n=443): 47% continue, 52% reverse, median 30-minute follow-through -10bp. Statistical noise. Bursts this size are routine in these names - AMC printed 2.5 per day, BYND 2.8 - and carry no directional information.
- 2.5-4% bursts (n=75): 56% continue, median +39bp at 30 minutes. The upside subset is stronger still - 61% continuation and +71bp median (n=38). This is the momentum zone.
- ≥4% bursts (n=17): 65% reverse, median -85bp at 15 minutes and -45bp at 30 minutes. Small sample, stated plainly - but the sign flip versus the 2.5-4% bucket is the finding. Chasing the biggest bars is statistically the worst trade on the ladder.
- Clustering is monotone: 33% → 71% → 94%. After a ≥4% burst, another burst inside 30 minutes is close to a certainty. The first burst is not a trade signal - it is a regime announcement.
- The controls confirm the mechanism: SPY and TSLA printed zero qualifying bursts in 60 sessions; NVDA printed three. This is a Tier 2, high-short-interest phenomenon - the names where the band is 10% away and borrow is expensive.
Why the ladder bends at the band
A 2.5-4% burst has room left in the band, real flow behind it, and trapped shorts paying expensive borrow on the wrong side - the move continues because nothing mechanical stands in its way. A ≥4% burst is different: every participant on the tape can compute exactly where the limit state sits, because the band is published arithmetic, not chart opinion. Liquidity providers reload quotes at a regulation-defined price. Profit-taking gets pulled forward because nobody wants to carry size into a possible five-minute pause where their order queues blind into a reopening auction. The marginal buyer who would extend the move steps back precisely because the wall is visible.
The clustering number is the deeper structural fact. A 94% probability of another burst within 30 minutes means the information content of the first burst is not “price goes up” or “price goes down” - it is “the next half hour will be violent.” Volatility is the forecastable part; direction is not.
How we trade the tripwire
We ignore the first rung. Sub-2.5% bursts in halt-prone names are base-rate noise with a 47/52 split and negative median follow-through. Reacting to them is paying spread for a coin flip.
We trade the 2.5-4% rung as continuation, with flow confirmation. The entry is the first pullback that holds above the burst bar's VWAP with CVD still rising - not the burst itself. The 61% continuation rate and +71bp median on upside bursts is the payable edge, and it only survives controlled-spread execution.
We fade the ≥4% rung only at structure, never in motion. The 65% reversal rate does not license shorting a vertical bar. We wait for the tape to stall - a failed retest on declining aggression - and size for the 94% probability that another violent bar is coming, in either direction.
We pre-plan the halt instead of reacting to it. On a limit state we cancel resting orders immediately - anything left behind queues into the reopening auction at a price we no longer control. Into the reopen we read the published imbalance, let the auction print, and treat the first two minutes as the widest-spread tape of the session. The reopen is a brand-new open with a brand-new book; queue priority from before the halt is gone.
We secure borrow before the burst, not after. The same move that threatens the band often trips the SSR, and short entries afterward must price above the national best bid for two sessions. Locates on the halt-prone watchlist are a pre-market task through multi-vendor HTB - by the time the tripwire is live, the borrow window has closed.
Infrastructure is the position. A 94% cluster rate means decisions in this regime land in seconds, not minutes. Pre-built bracket orders, hotkey cancels, and DMA routing through Sterling Trader Pro are what make the tripwire tradable at all - the same setup on a retail app is a spectator seat.
The takeaway
The LULD band is the one intraday level that is regulation rather than opinion, and the tape respects it before it is ever touched. Mid-size velocity is fuel; band-stress velocity is a wall; and every burst, whatever its size, is a forecast of more velocity within the half hour. The traders who make money in halt-prone names are not the ones who predict the halt - they are the ones who know where the tripwire sits before the tape starts running.
At Vortex Capital Group, we give qualified traders the DMA execution, multi-vendor locates and order-flow analytics required to trade halt-prone tape with a plan instead of a reaction.
#LULD #TradingHalts #HaltReopen #VelocityBursts #MarketMicrostructure #SSR #AMC #SMCI #DayTrading #DMA #PropTrading #VortexCapitalGroup
Trade with the desk behind the research
Vortex Capital Group gives qualified traders DMA via Sterling Trader Pro, multi-vendor HTB locates, smart and dark-pool routing, and an 80%+ monthly profit share.
Apply to Trade