
Korea's 38% Round Trip: What EWY Actually Is When Seoul Is Closed
TL;DR - KOSPI closed at 9,114.55 on 22 June 2026 after a +241% run from January 2024, then closed at 5,593.56 on 30 July - -38.6% in five weeks - and sits at 6,912.95. From the US side the vehicle is EWY, which fell -34.2% peak to trough. The structural fact that governs everything else: KRX trades 20:00-02:30 ET, so EWY's overnight gap spans the entire Seoul session and its US cash session runs with Korea shut. Those two legs behave like different instruments. The gap is explained by KOSPI (R² 0.19-0.42) and not at all by the prior day's semis (R² 0.00-0.10); the US session is the reverse. In the crash the gap delivered -21.5% and the US session -5.1% - Seoul did about four-fifths of the damage while US-based holders were asleep. In the calm period before it, the US session did more of the work (+55.5% vs +39.5%). It was not a Korea crisis: in local-currency terms the bank ADRs were flat (KB +0.7%, Woori +3.1%, Shinhan -1.8%) while LG Display fell -40.4% and POSCO -20.1%, and the won strengthened 11.8% from its June high straight through the collapse. And the obvious conclusion - hedge Korea with semis - fails out of window: long EWY short 1.21x SMH turns 2.88 into 0.55 across 2024-2026, with a worse drawdown than being unhedged. What does survive is informational: EWY's US session predicts the next Seoul session with P(KOSPI up | EWY US session up) = 70.1% against a 57.6% base rate, and it holds with semis controlled for. From the US side, EWY gives you information about Korea, not protection from it.
Korea just ran one of the more violent round trips in a developed market: a doubling and a half, then a 38.6% close-to-close drawdown in twenty-five sessions, then a partial recovery that included the largest single-day gain in the index's history. If you sat in Seoul you lived it in real time. If you sat anywhere else, you experienced it as a series of gaps.
This post is about the second experience, because the instrument most non-Korean traders used - the iShares MSCI South Korea ETF, EWY - behaves in a way that is not obvious and that the drawdown made expensive.
The clock is the whole story
KRX runs 09:00-15:30 KST. Korea Standard Time is UTC+9, so during US daylight time the Seoul session is 20:00-02:30 ET. It closes seven hours before New York opens.
That produces a strict sequence. On any calendar date D: Seoul's session for D ends at 02:30 ET, then EWY trades 09:30-16:00 ET, then Seoul opens again for D+1 at 20:00 ET that evening. So:
- EWY's overnight gap (prior close to today's open) contains the Seoul session.
- EWY's US cash session runs entirely with Korea closed.
That mapping is not an assumption. Correlating KOSPI's daily return against EWY's overnight gap gives +0.528 at zero offset, and it collapses at every other alignment (+0.206 one day back, -0.080 one day forward). The gap really is Seoul.
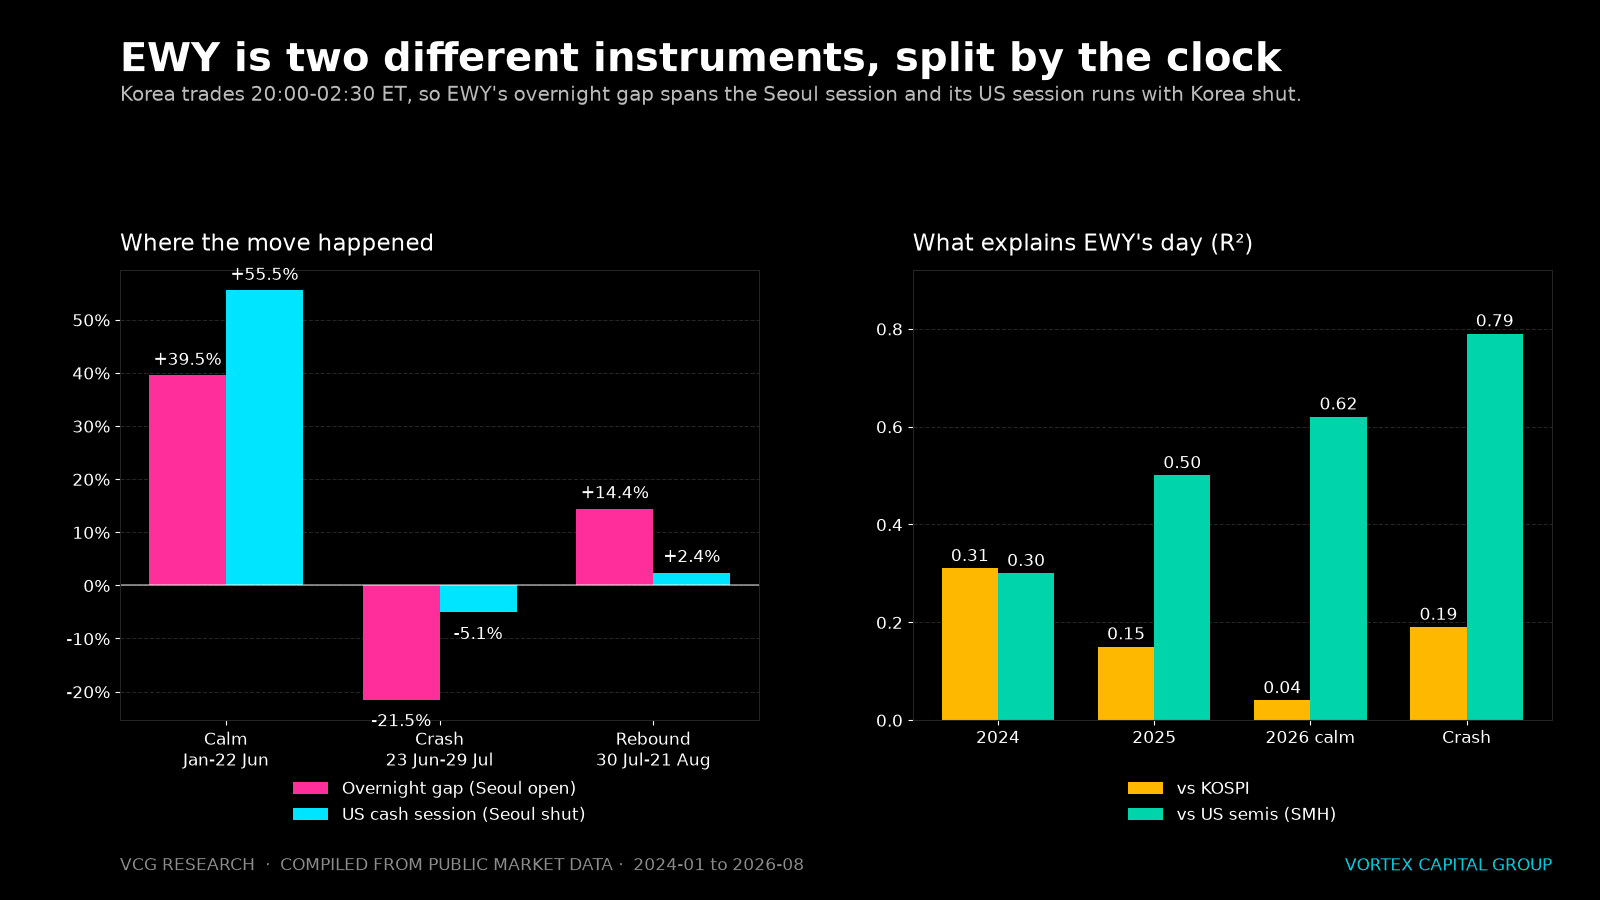
Finding 1: the two legs are different instruments
Split EWY's daily return and ask what explains each leg.
| R² vs KOSPI | R² vs US semis (SMH) | |
|---|---|---|
| EWY full day, 2024 | 0.31 | 0.30 |
| EWY full day, 2025 | 0.15 | 0.50 |
| EWY full day, 2026 calm | 0.04 | 0.62 |
| EWY full day, the crash | 0.19 | 0.79 |
| EWY overnight gap only | 0.19-0.42 | 0.00-0.10 |
Read the last row against the others. The gap tracks Korea. The full day increasingly does not - by early 2026, KOSPI explained 4% of EWY's daily variance while SMH explained 62%. EWY had quietly become a semiconductor instrument that resets to Korea once a day at the open.
That is a composition fact, not a mystery: MSCI Korea is dominated by Samsung Electronics and SK Hynix, and during US hours the marginal price for those two is set by whatever is happening to the global semis complex.
Finding 2: in the crash, Seoul did the damage
Decomposing the two legs cumulatively:
| Phase | Overnight gap (Seoul open) | US session (Seoul shut) | Total |
|---|---|---|---|
| Calm, 2 Jan - 22 Jun | +39.5% | +55.5% | +116.9% |
| Crash, 23 Jun - 29 Jul | -21.5% | -5.1% | -25.5% |
| Rebound, 30 Jul - 21 Aug | +14.4% | +2.4% | +17.1% |
The regime flips. In the calm phase, most of EWY's return was manufactured in New York while Korea slept. In the crash, roughly four-fifths of the damage arrived in the gap - delivered by a market that was open while every US-based holder was unable to act.
This is the practical core of the whole episode. A US-based trader in EWY through late June and July was not managing a position. They were receiving one, once a day, at 09:30.
Finding 3: it was not a Korea crisis
The natural story for a 38% index drawdown is a country problem - credit, capital flight, currency. The cross-section says otherwise. Because the ADRs are USD-denominated and the won moved, the local-currency column is the one that matters:
| Peak → trough, USD | Peak → trough, local currency | |
|---|---|---|
| LG Display (LPL) | -37.2% | -40.4% |
| EWY | -34.2% | -37.5% |
| POSCO (PKX) | -15.8% | -20.1% |
| SK Telecom (SKM) | -13.8% | -18.2% |
| Coupang (CPNG) | -12.4% | -16.9% |
| Woori (WF) | +8.7% | +3.1% |
| KB Financial (KB) | +6.1% | +0.7% |
| KT Corp (KT) | +3.7% | -1.6% |
| Shinhan (SHG) | +3.5% | -1.8% |
The banks were flat. Not up 6% - that part was the currency - but flat, in a five-week window that took 38% off the index. A Korean credit event or a capital-flight event takes the banks down first and hardest. It did not happen.
The currency says the same thing. USD/KRW peaked at 1,554.48 on 8 June, two weeks before equities topped, and the won then strengthened 11.8% to 1,390.79 by 21 August - straight through the collapse. Capital was not fleeing. The daily relationship between EWY and USD/KRW is statistically nothing in either direction (R² 0.03 during the episode, 0.05 in the calm period).
What was left was the semiconductor complex. SMH fell -24.6% over the same window and Taiwan's EWT -19.8%. How much of Korea's move that accounts for depends on the beta you assume, and the honest answer is a range rather than a number:
| Assumed beta to SMH | Imported | Korea-specific residual |
|---|---|---|
| 1.00 | 72% | -9.5 pts |
| 1.21 (estimated pre-crash) | 87% | -4.4 pts |
| 1.50 | 108% | +2.8 pts |
The point estimate using the ex-ante beta is 87% imported. I would not defend the second decimal on 26 observations - but every non-parametric piece of evidence points the same way, and none of it needs a fitted number.
One caution on the word "semis": in the calm period Taiwan explained EWY better than US semis did (R² 0.75 vs 0.62), and during the crash SMH won (0.78 vs 0.64). The common factor is the global semiconductor complex, not specifically the US listing of it.
Finding 4: the hedge that "worked" did not work
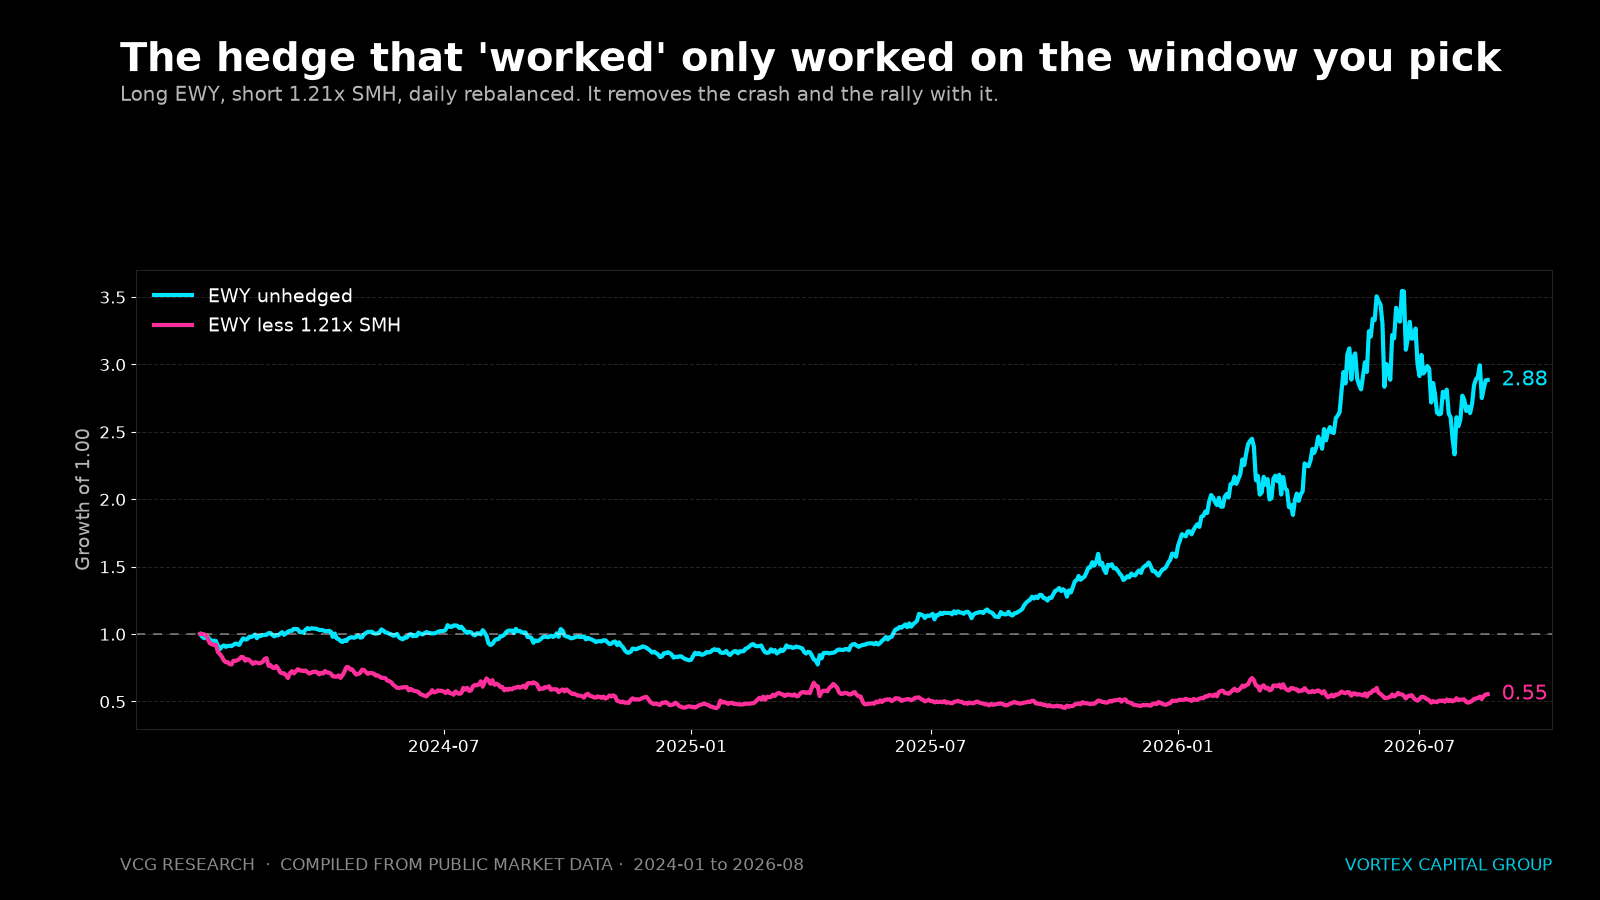
If Korea is 87% semis, hedge it with semis. Over the crash window that looks superb: long EWY, short 1.21x SMH, daily rebalanced, turns -34.2% into -6.0% and cuts annualised vol from 72.1% to 34.5%.
That window starts at the crash and ends at the exact trough. Both dates were chosen after the fact. Run the identical sleeve over windows nobody picked:
| Window | Unhedged | Short 1.21x SMH |
|---|---|---|
| 2025 full year | +95.3% (max DD -16.3%) | +8.6% (max DD -29.2%) |
| 2026 YTD | +83.4% | +9.9% |
| 2024-01 to 2026-08 | +188.4% | -44.7% (max DD -55.0%) |
Growth of 1.00 across the full sample: 2.88 unhedged, 0.55 hedged. The sleeve removed the crash and the +241% rally that preceded it, and in 2025 it produced a larger drawdown than simply owning the thing.
This is the part worth internalising. A hedge that only helps in the window you selected is not a hedge, it is a directional trade on semiconductors that you would have had to time. The same arithmetic that says "87% of the drawdown was imported" also says "87% of the rally was imported" - you cannot subscribe to one and not the other. And the KRW hedge that intuition reaches for first would have done nothing (R² 0.03) while costing money, because the won strengthened.
Finding 5: what does survive is information
EWY's US session lands between two Seoul sessions, which makes it a testable forecast of the next one.
Over 619 sessions from January 2024: regressing the next Seoul session on EWY's US session gives beta 0.70 with a t-statistic of 12.19. The directional version, stated against its base rate so it means something:
- KOSPI is up on 57.6% of all days in the sample - it was a bull market.
- P(KOSPI up | EWY's US session up) = 70.1% (n=328).
- During the episode: base rate 52.4%, conditional hit rate 65.9%.
And it is not merely "US semis lead Korea." Put EWY's US session and SMH's return in the same regression: EWY holds at 0.51 (t = 7.40) while SMH drops to 0.20 (t = 4.85). During the episode EWY carries essentially all of it - 0.96 (t = 2.06) against SMH at 0.17 (t = 0.53), statistically indistinguishable from zero.
The clearest single instance is the turn. EWY bottomed on 29 July; KOSPI bottomed on 30 July. On 30 July EWY closed +11.79% while KOSPI was still down 1.23% that session - and Seoul then posted +17.91% the next day, the largest one-day gain in the index's history. New York called it a session early.
Finding 6: the trade that is not there
One tempting mechanism deserves killing. The EWY gap only passes through 0.40-0.67x of the Seoul move - it systematically under-delivers. It is natural to assume the remainder gets made up during the US session, which would be a clean intraday trade.
It does not. Regressing the US session on the undelivered remainder gives a beta of -0.05 to -0.15 with R² between 0.004 and 0.045 - slightly negative, essentially zero. Setting quintile thresholds on 2024-2025 and applying them to 2026 out of sample produces a negative spread in both sub-periods.
The reason is Finding 1: EWY is not a lagged KOSPI. It is a differently-composed, USD-denominated instrument repricing on newer information. There is nothing mechanical to collect.
What we would actually take from this
- Own the clock before you own the position. If your exposure to Korea is EWY, the majority of your risk in a stress regime is delivered in a gap you cannot trade. Size for that, or accept you are a passenger.
- Don't hedge a factor you also want. The semis beta that hurt in July is the same beta that paid from 2024 to June. If you genuinely want Korea without semiconductors, EWY is the wrong instrument - the bank ADRs held their local value through the entire drawdown.
- Use the US session as a read, not as an exit. A 70% conditional hit rate on next-day direction is a real edge for positioning, and it is the one thing here that is specific to EWY rather than to semis. It is not large enough to trade blind, and it will not save you on a gap.
- Watch the cross-section, not the index. Banks flat while displays fell 40% told you what kind of event this was inside the first week, and it required no model.
We wrote about the six-hour handoff between the Seoul close and the US open in Seoul to New York, and about using KOSPI's close as an input to the SPY gap distribution in KOSPI 종가로 읽는 SPY 갭 채움 확률. The Korean-language version of this study is 코스피 38% 왕복.
A correction to our own earlier work. In 코스피 크랙 해부, published the day after the 23 June session, we argued that USD/KRW had given a week's early warning of the break. On the full episode that reading does not hold. The won peaked on 8 June and then strengthened 11.8% straight through the drawdown, and the daily EWY-KRW relationship is statistically empty in both regimes (R² 0.03-0.05). The single case looked like a signal; the population does not support it. That post's description of the 23 June session remains accurate - its causal claim about the currency does not.
Method and caveats
US-side data is Alpaca consolidated (SIP) daily bars, split- and dividend-adjusted. KOSPI and USD/KRW are daily closes from yfinance, which is what we use it for. The KOSPI series was validated against independent reporting: the widely cited record of 9,385.59 on 19 June is the intraday high and appears in the series exactly; all figures quoted here are close-to-close, so the peak is 9,114.55 on 22 June and the drawdown -38.6% rather than the -40%+ figures computed from the intraday high. The OHLC rows are internally consistent with zero exceptions.
The episode regressions run on 26 to 43 observations and the betas should be read as indicative. Local-currency ADR returns are approximations - the USD return scaled by the USD/KRW change - not the actual KRX-listed lines, and they ignore any ADR-specific basis. Hedge results are gross: no borrow cost on the SMH short, no financing, no spread, no rebalancing cost, all of which make the hedged column worse than shown, not better. The conditional hit rates are in-sample across the full period; the quintile test in Finding 6 is the only genuinely out-of-sample exercise here. A single episode, however violent, is one observation of a regime - none of this establishes what the next one looks like.
More for Korea Traders
- Trading US Equities from Seoul: What Korean Day Traders Need to Know
- KOSPI 종가로 읽는 SPY 갭 채움 확률 - 한국 시간대 데이트레이딩 전략Korean
- 서울에서 뉴욕까지: 한국 반도체 종가가 미국 SMH·NVDA 개장을 어떻게 예고하는가Korean
- 한국 데이트레이더를 위한 미국 개장 첫 5분 반전 매뉴얼Korean
- 코스피 크랙 해부: 6개월 +79% 랠리, 하루 -12.2%, 그리고 원화가 일주일 전에 보낸 경고Korean
- 코스피 38% 왕복: 서울이 닫혀 있을 때 EWY는 무엇인가Korean
Trade with the desk behind the research
Vortex Capital Group gives qualified traders DMA via Sterling Trader Pro, multi-vendor HTB locates, smart and dark-pool routing, and an 80%+ monthly profit share.
Apply to Trade