
Basket Impact Ratio: A Better Tape Read for Sector Momentum Trades
- Apr 29
- 2 min read
Updated: 1 day ago
TL;DR — Basket Impact Ratio is our check against single-name tunnel vision. When a semiconductor name diverges from SMH or a mega-cap diverges from XLK, the next-day median single-name return tells us whether the divergence is the start of leadership or a one-day fluke. Across NVDA / AMD / AVGO vs SMH and META / AAPL vs XLK, mild positive divergence (+1% to +3% above the basket) prints +0.15% next-day median — modest momentum continuation. Strong divergence (>+3%) prints only +0.03% — exhausted, no follow-through.
Single-name traders fall into one of two patterns: ignore the sector entirely and trade the candle in isolation, or follow the sector blindly and miss the names that actually have leadership. The Basket Impact Ratio (BIR) sits between the two — it forces the question: how different is this name's behaviour from its sector, and does that difference imply edge?
What divergence actually predicts
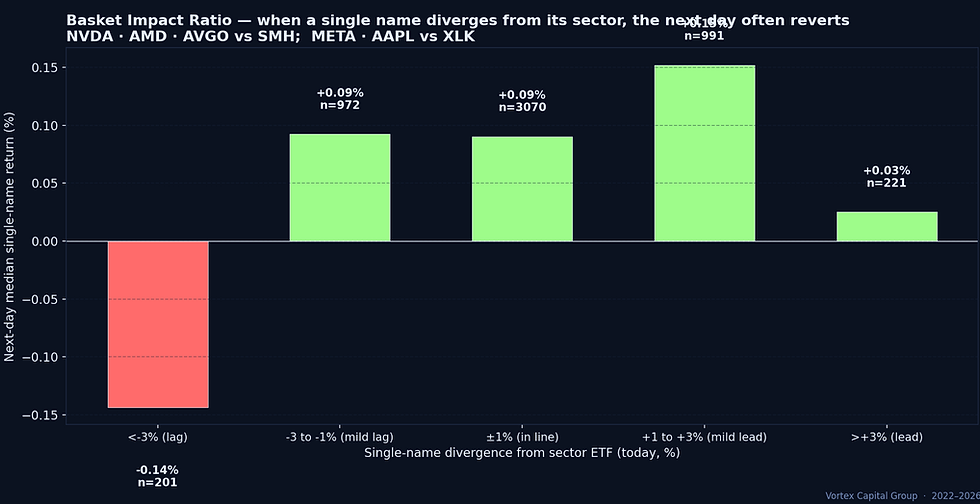
The chart pools five name-vs-sector pairs (NVDA/SMH, AMD/SMH, AVGO/SMH, META/XLK, AAPL/XLK) across 2022–2026, bucketed by today's divergence between single-name and sector ETF returns:
Strong lag (<−3% below sector): next-day median −0.14%. The name is bleeding faster than the basket — and the bleed continues.
Mild lag (−3 to −1%): next-day median +0.09%. Slight recovery — but not enough to chase.
In-line (±1%): next-day median +0.09%. The default — sector beta dominates, name-specific signal is weak.
Mild lead (+1 to +3%): next-day median +0.15% — the sweet spot. Modest single-name strength that the sector hasn't fully matched tends to continue.
Strong lead (>+3%): next-day median +0.03%. The name has already extended too far; the move is exhausted.
How the desk uses BIR
Mild lead is the high-edge bucket. When NVDA prints +2% on a day SMH prints +0.5%, BIR = +1.5% — exactly the bucket that prints +0.15% next-day median. We size accordingly.
Strong lead is the warning bucket. NVDA +5% on SMH +1% (BIR +4%) is the bucket where chasing the next day has near-zero expected value. The setup looks similar but the data inverts.
Strong lag is the avoid bucket. A name underperforming its sector by >3% in one day usually continues underperforming. "It must bounce" is the most common mistake here.
Why basket context beats single-chart focus
Single-name traders systematically underweight basket flow. A name moving +2% feels strong; the same +2% during a +1.5% sector day is much weaker context. BIR forces the comparison every time, and the data shows the comparison matters: the asymmetry between mild lead (+0.15% follow-through) and strong lead (+0.03%) is exactly the kind of regime detail that's invisible without the basket cross-check.
Related
Joining the desk
Traders who already cross-check single-name moves against sector ETFs are running a BIR discipline whether or not they call it that. The trader application takes about ten minutes.


Comments