
The Mega-Cap PEAD Inversion: When the Reaction Is the Trade, and When It Is the Trap
- 4 days ago
- 4 min read
TL;DR — We pulled 91 mega-cap tech earnings events (AAPL, MSFT, GOOGL, AMZN, META, NVDA, TSLA) between 2023 and 2026. Classical post-earnings drift inverts at the extremes in this universe: a >+3% event-day reaction fades −5.58% over the next 20 days; a <−3% reaction bounces +3.46%. Information no longer diffuses slowly here — it explodes into one print and mean-reverts. We trade the structure, not the textbook.
Post-earnings announcement drift, or PEAD, is one of the most documented anomalies in equity research. The textbook version: stocks that beat earnings continue to drift higher for weeks; stocks that miss continue to drift lower. First published in the late 1960s, reproduced through the 1990s with remarkable consistency.
It's also — for mega-cap US technology between 2024 and 2026 — no longer the right model. What replaces it isn't random. It's the opposite, and the structural reason matters more than the result.
How we tested it
We pulled 91 quarterly earnings events for AAPL, MSFT, GOOGL, AMZN, META, NVDA and TSLA between January 2023 and April 2026 from yfinance daily OHLC. For each event we measured the event-day reaction (close vs prior close, capturing the after-hours print and the next session's open), then the 5-day and 20-day forward return from the event-day close. We bucketed events by event-day reaction into four bands: Strong negative (<−3%), Mild negative (−3% to 0%), Mild positive (0% to +3%), Strong positive (>+3%).
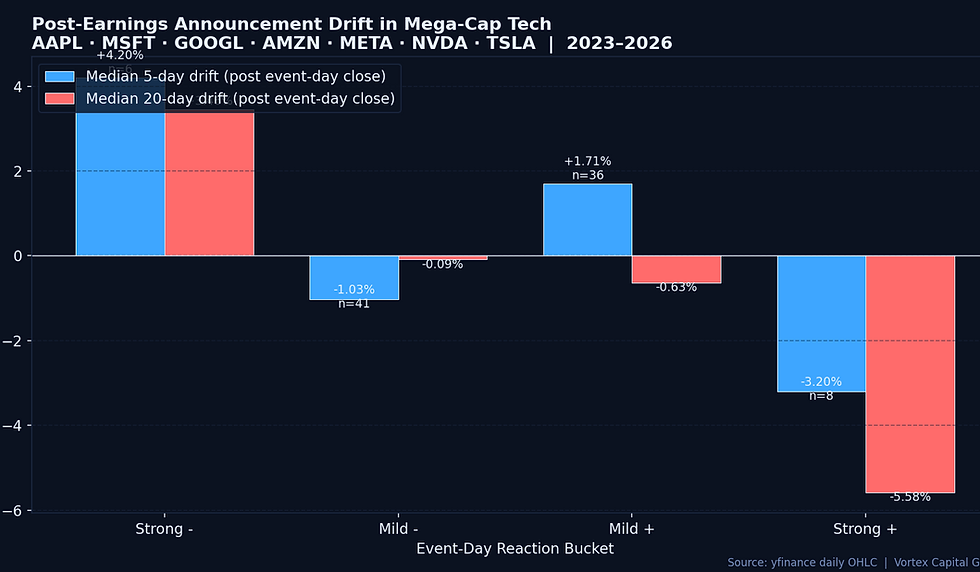
The mega-cap inversion
Strong positive reactions faded. When event-day reaction was greater than +3% (n=8), the median 20-day forward return was −5.58% and the 5-day was −3.20%.
Strong negative reactions bounced. When event-day reaction was worse than −3% (n=6), the median 5-day return was +4.20% and the 20-day was +3.46%.
Mild reactions decayed asymmetrically. Mild positives (n=36) showed +1.71% over 5 days then gave it back (−0.63% at 20 days). Mild negatives (n=41) bled further at 5 days (−1.03%) but flattened by day 20.
Why classical PEAD inverted in mega-cap tech
The mechanical explanation is short. Mega-cap tech earnings are now event-driven option flow more than they are slow institutional repricing. Three weeks of implied volatility, dealer gamma, retail call-spread structures and short-dated 0DTE flow are concentrated into a single overnight window. By the time the cash session opens, most of the institutional reprice has already happened — in after-hours and in pre-market block prints. What remains in the first session is dealers rebalancing hedges, retail chasing the move, and momentum funds taking the easy continuation.
Classical PEAD assumed information diffuses slowly. In a market where the same earnings number is being priced by 26 exchanges, 50+ dark pools, and a derivatives complex five times the size of the underlying, information doesn't diffuse slowly in mega-cap tech anymore. It diffuses violently into one bar — and then the bar is corrected.
What this isn't
This isn't a "fade every strong earnings reaction" rule. The Strong + bucket has eight observations and a wide return distribution under that median. Two earnings events that printed +10% and gave it all back drive a lot of the result. What the data does support is more careful: the prior assumption that strong reactions confirm directional thesis for weeks is no longer load-bearing. Position sizing and confirmation standards on day-3 through day-20 should reflect that — not assume continuation by default.
The pattern is concentrated in mega-cap tech and may not generalize to small-cap or non-tech earnings, where institutional participation is lower and information diffusion remains slower. Treating PEAD as one rule across the whole market is the original error this study corrects.
How we trade the inversion
Treat the event-day print as the conclusion, not the start. When a mega-cap closes more than 3% in one direction on earnings, the expected information value of "more in that direction" over the following month is approximately zero in our sample. That's a sizing constraint, not a reversal signal.
Hunt for mismatches. A name that prints a strong-negative reaction and then absorbs the move on day two with rising relative volume and constructive CVD is statistically more interesting than a name extending a strong-positive print. Our Vortex Flow order-flow lens — CVD slope, VWAP position, dark-print clustering — identifies which strong reactions are being faded by real flow versus chased by retail.
Calibrate confirmation to gamma decay. The first three to five sessions after a mega-cap earnings event are dominated by options unwind. Dealer gamma exposure flips from defensive to passive over that window. Trades initiated inside the gamma-unwind window need tighter confirmation thresholds than the same setup in week three.
Route discipline matters more, not less, after earnings. Spreads stay structurally wider for several days post-earnings in this universe. Our DMA through Sterling Trader Pro — hidden and pegged order types — is how we avoid paying twice for participation in a name still digesting its print.
The takeaway
Classical post-earnings drift is a 1968 anomaly that survived for half a century because information diffused slowly. In mega-cap US technology in the current regime, information doesn't diffuse slowly anymore — it explodes into one print and mean-reverts. Traders who carry the textbook drift assumption into this universe will compound the wrong bias for weeks. The data says the opposite of the textbook, and the reason is microstructural, not statistical noise.
At Vortex Capital Group, we give qualified traders the order-flow analytics, capital, and execution infrastructure to trade mega-cap event structure on the right side of the inversion — rather than the textbook side.


Comments