Trading Insights
Research from the desk
Every post is backed by a real data study — measured on the tape, not folklore. Market structure, execution intelligence, order flow, and short-selling mechanics.

The Opening-Print Mirage: Why the Illiquid-ETF iNAV Arb Doesn't Survive Costs
We tested the 'buy the cheap open in a thin ETF and ride it back to fair value' trade on 119 sessions of 2026 data, with real full-tape opening spreads. The dislocation is real — but strip out market beta and pay the spread you actually have to cross, and the edge collapses to zero. And it does not grow in the thinnest names, which is the opposite of what the story predicts.
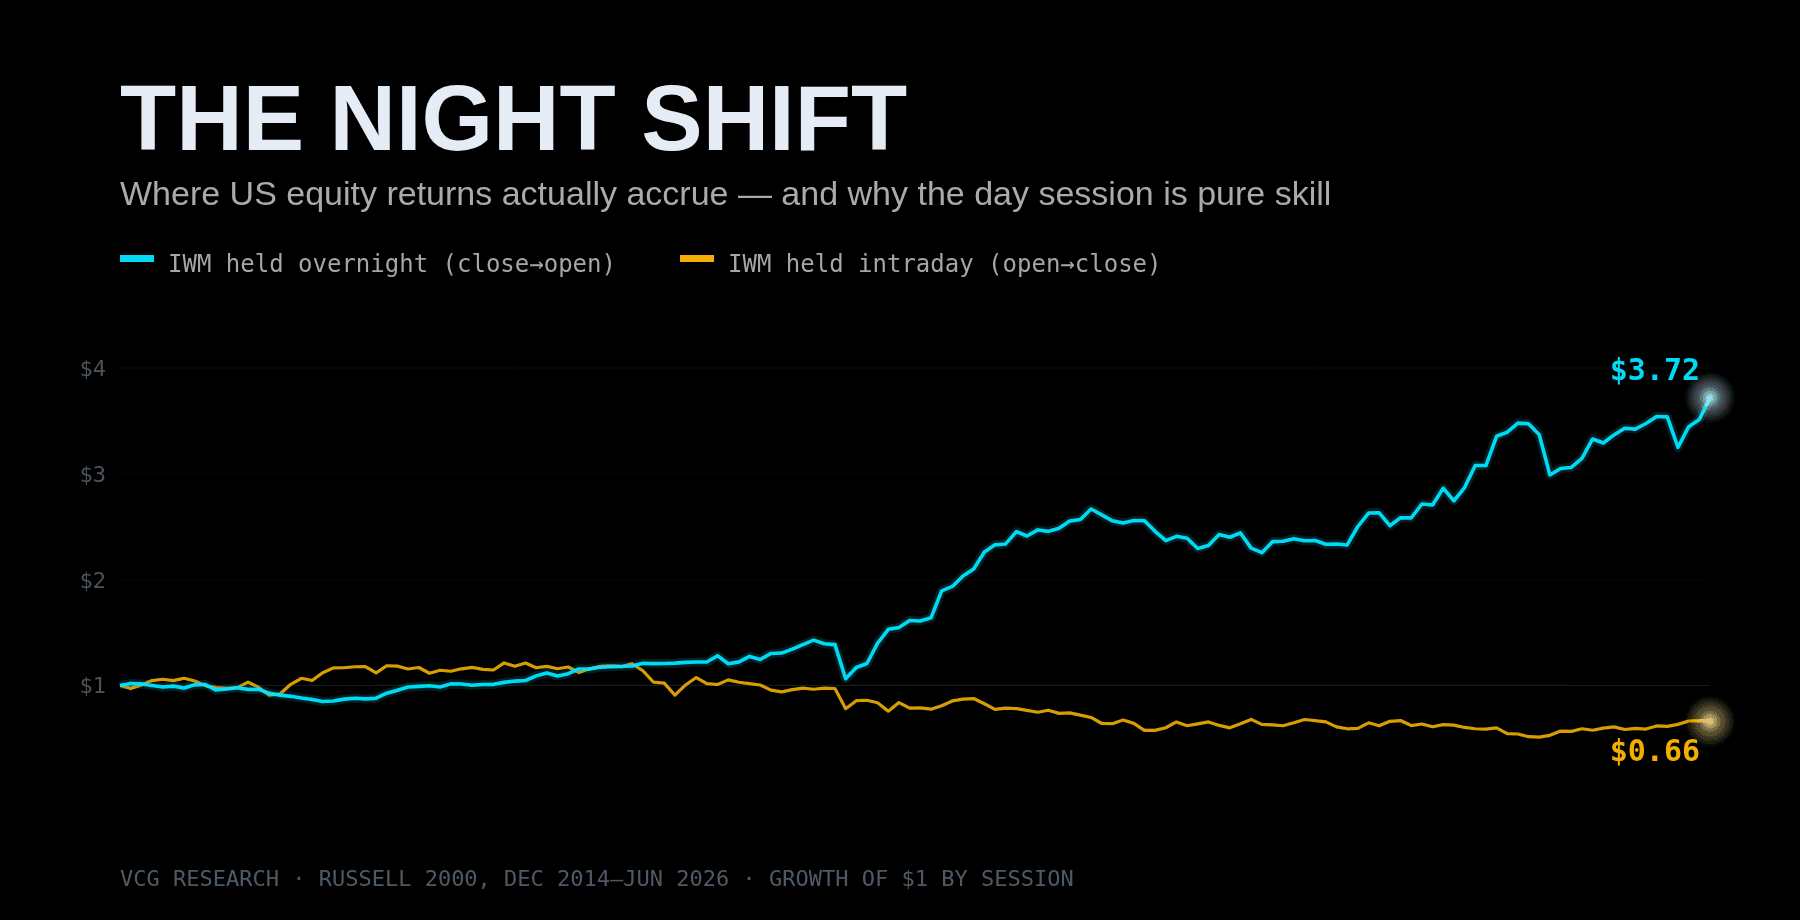
The Night Shift: Where US Equity Returns Actually Accrue — and Why the Day Session Is Pure Skill
Split a decade of SPY, QQQ and IWM into two sessions — overnight (close→open) and intraday (open→close) — and almost all the drift turns up overnight. In the Russell 2000, the day session a prop desk actually works lost money over eleven years. That isn't a trade. It's the clearest argument for why intraday edge has to come from skill, not beta.

The SIP Lag: How a Stale Public Quote Becomes a Hidden Execution Tax
The consolidated tape (SIP) is structurally slower than direct exchange feeds — by design, not by accident. What that lag costs a fast trader, when it widens, and why the feed you watch matters as much as the strategy you run.

Risk-Off Equity Routing: How VIX Spikes Reprice SPY & QQQ
When VIX clears 28, SPY intraday range medians 2.2% — 3x calm-tape behaviour. A data-driven risk-off routing playbook for prop and proprietary traders.

Yield Shock Playbook: QQQ, NVDA & SMH When Rates Move
The 'yields up = tech down' rule is wrong about NVDA. 1,092 sessions of data show NVDA decouples on big yield-up days. Sizing and routing framework inside.
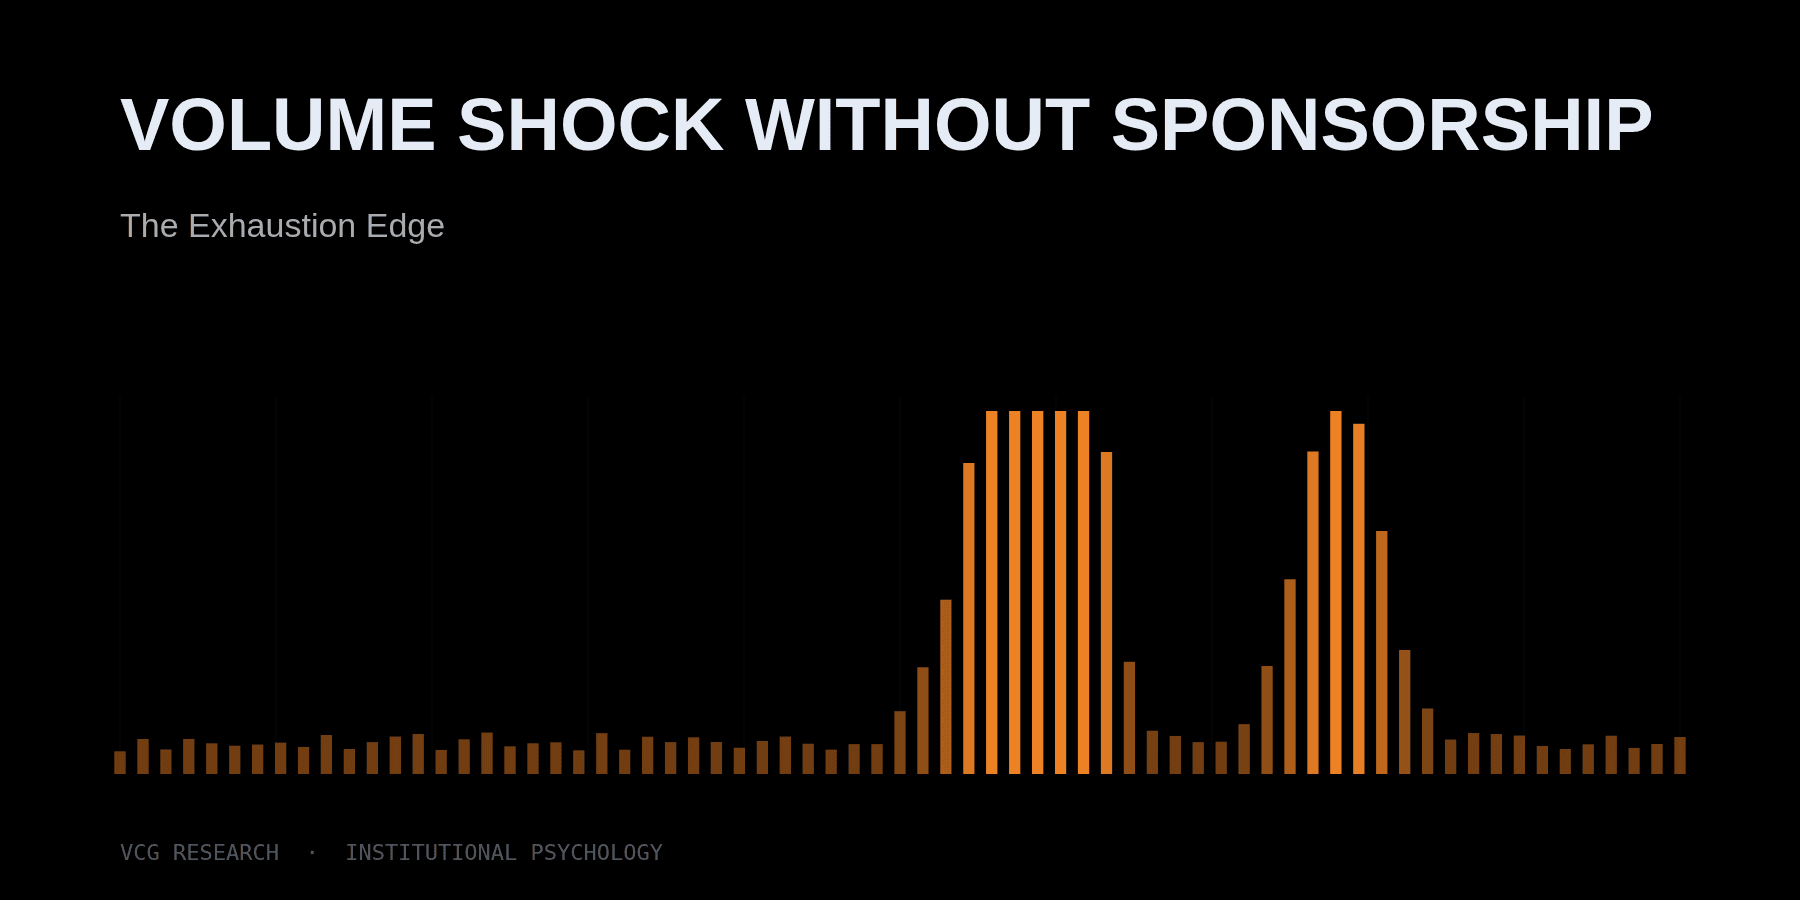
Volume Shock Without Sponsorship: The Exhaustion Edge
Across 5,365 sessions, high relative volume produced exhaustion closes 49% of the time. How prop traders separate participation from sponsorship in real time.

The Gap-Chase Trap: Why Strong US Equity Opens Fade
3,463 gap-up sessions on QQQ/NVDA/TSLA show intraday fade is 50% at every gap size — but the gap itself rarely fills above 2%. The trade isn't the gap; it's the cash session.

The Halt Tripwire: LULD Band Math, Velocity Bursts, and Trading the Reopen
535 five-minute velocity bursts across 9 halt-prone names in 60 sessions: 2.5–4% bursts continue 56% of the time (+39bp median), but band-stress bursts ≥4% reverse 65%. Cluster rate climbs 33% → 71% → 94% — the burst is a regime announcement, and the LULD band is the wall.

OPG Orders & the Opening-Print Edge: ETF iNAV Dislocations
How desks use OPG (at-the-opening) orders to capture ETF opening-print dislocations from intraday fair value (iNAV): the mechanism, a worked example, why the edge is real but thin, and how it is executed.

ATR Compression Breakouts: Why the Pattern Fails
8,688 sessions of high-beta data show ATR compression does NOT raise breakout probability — the opposite. How prop traders actually use compression (and what we trade).

VIX-Adjusted Opening Range Sizing: QQQ, NVDA, TSLA
QQQ daily range is 3x wider at VIX 28 vs VIX 13. Same share size across regimes underperforms by design. A data-driven dynamic-sizing framework for prop day traders.
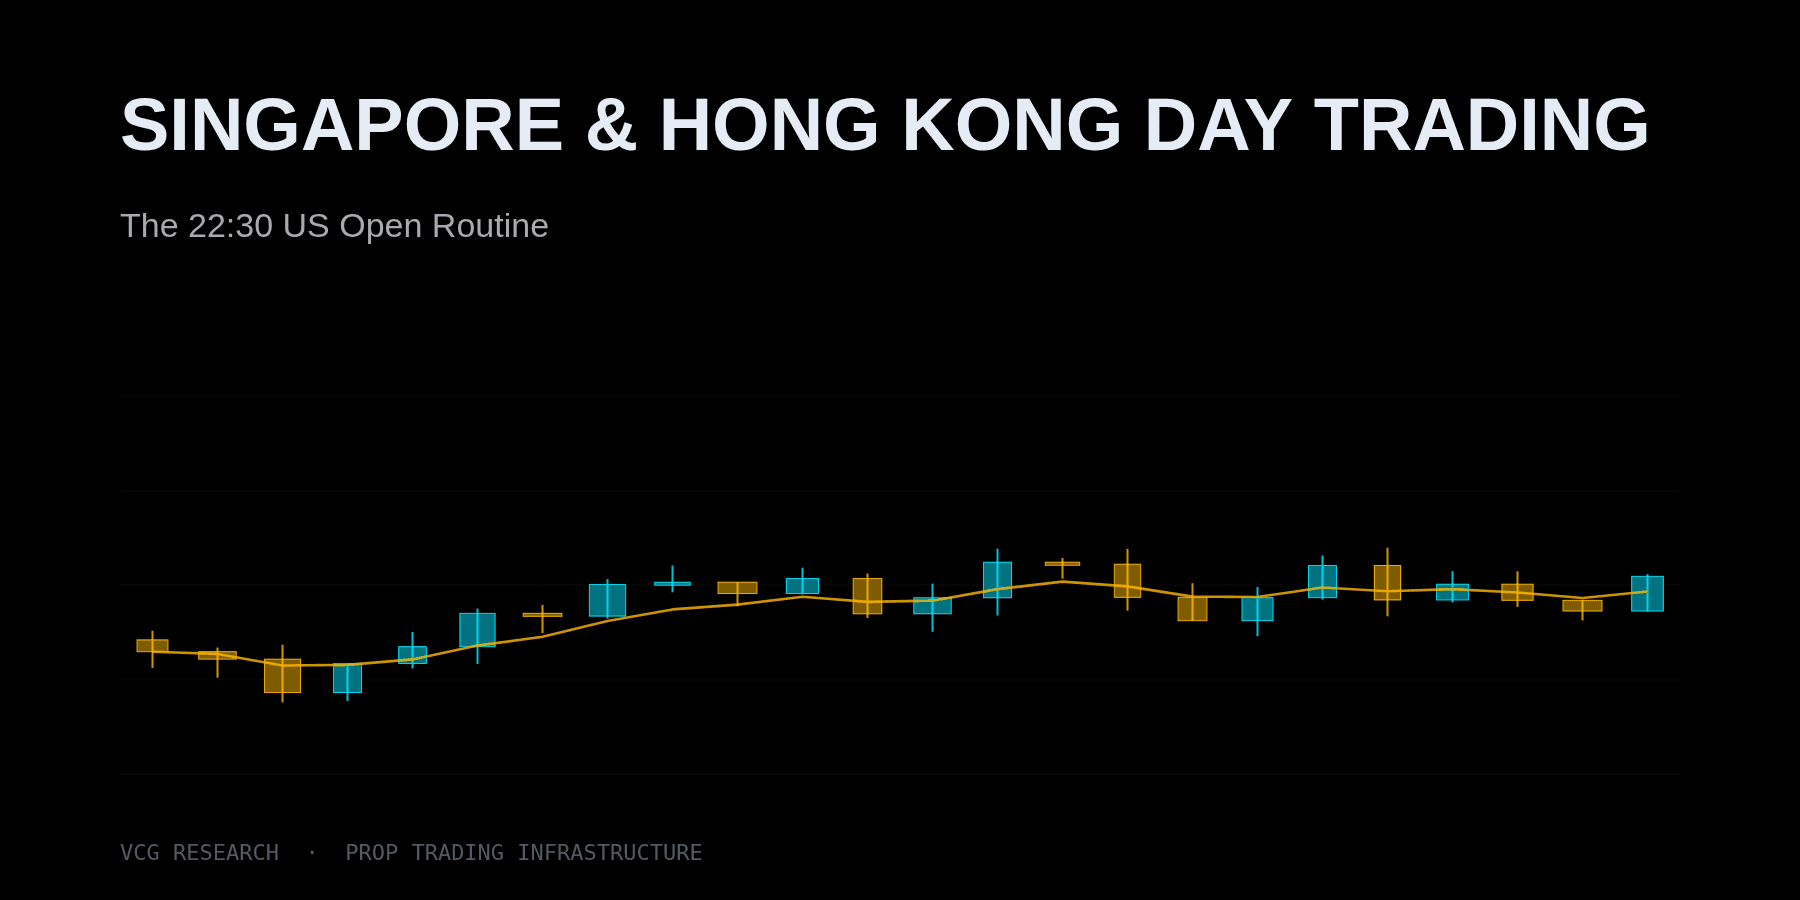
Singapore & Hong Kong Day Trading: The 22:30 US Open Routine
Singapore and HK traders own the cleanest time-zone setup for US equities. SPY's 09:30 ET open (22:30 HKT) carries 4x the per-minute volatility of any other window. A data-backed evening routine.

China ADR Trading Playbook: BABA, NIO, JD, PDD & KWEB Flow
China ADRs decouple from KWEB more than traders assume — BABA correlation swings 0.45 to 0.85. The data-backed cross-session framework prop desks actually run.

VIX Term Structure as a Breakout-vs-Fade Filter
Opening-range breakouts hit 23% in contango vs 11% in backwardation. How VIX/VIX3M conditions breakout follow-through, with the gamma mechanism behind it.

The Closing-Auction Magnet: What the Final 10 Minutes Actually Do
Data on ~48 sessions/name: the close extends the power-hour drift just 46–61% of the time. Which names tilt, how big the move is, and why route cost decides it.

MSTR & COIN as Intraday Bitcoin Beta: Sizing the 2.5× Proxy
5-min data shows MSTR at 1.72 beta / 2.47× vol and COIN at 1.48 / 2.55× vs IBIT, with no lead-lag edge. How the desk sizes leveraged crypto proxies intraday.

Smart Routes vs Manual Routes: When to Override the Router
A data-backed framework for when smart order routing works and when prop traders override manually. SPY intraday volume + range profile shows exactly where each tool earns its keep.
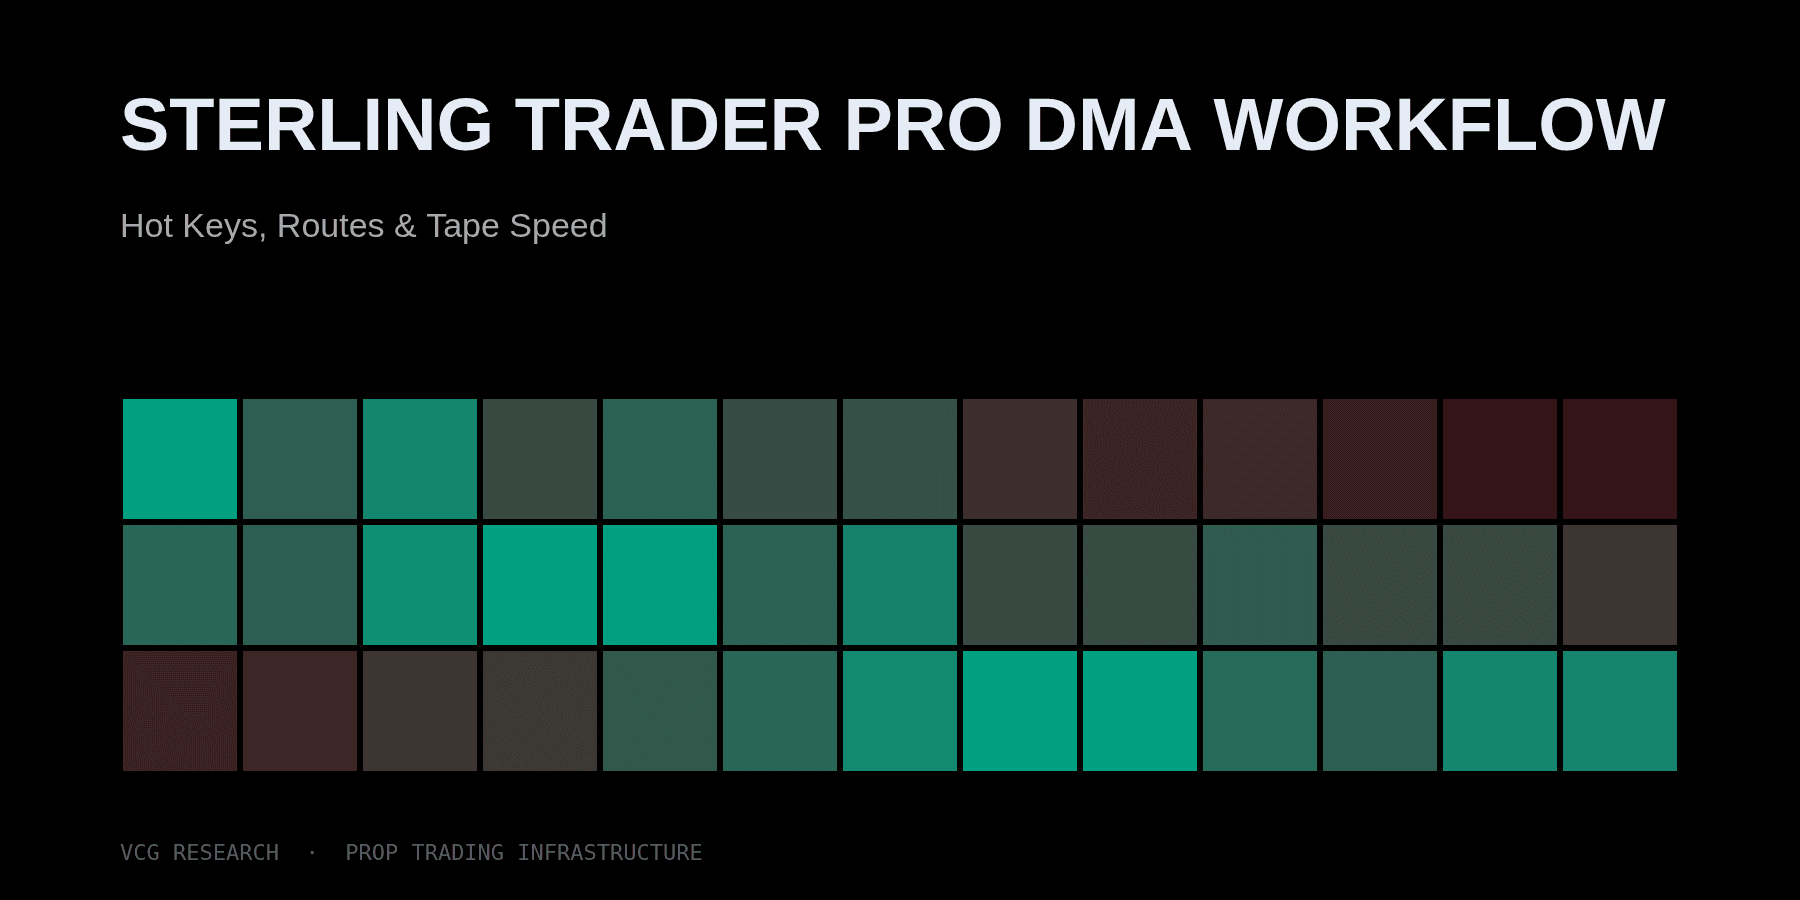
Sterling Trader Pro DMA Workflow: Hot Keys, Routes & Tape Speed
NVDA prints 9.8 bp per minute at the open vs 3.2 bp at lunch. Sterling Trader Pro's hotkey workflow is where active prop traders earn back the latency edge.

Gulf Sector-Gate ORB: A US Equity Strategy for Dubai & Riyadh Traders
Sector-gated ORB for Dubai, Abu Dhabi, Riyadh, Doha traders. QQQ + SMH confirmation at 10:15 NY = 18:15 Dubai. Recent 20-session study + DMA execution framework.
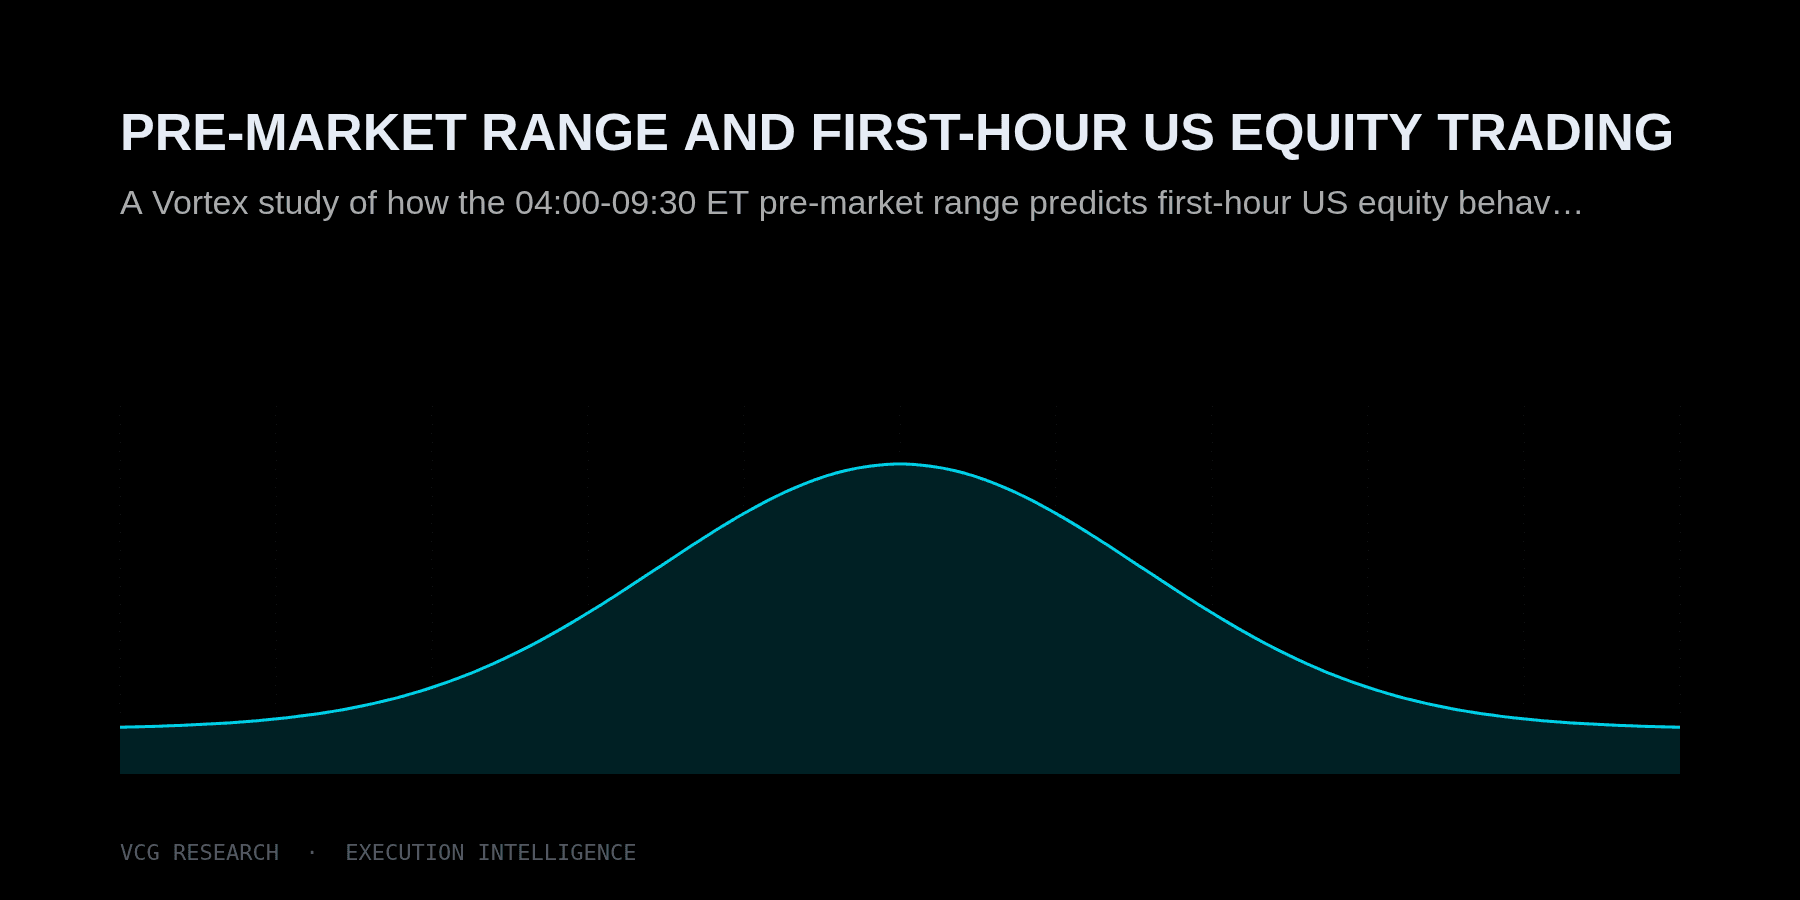
Pre-Market Range and First-Hour US Equity Trading
A Vortex study of how the 04:00-09:30 ET pre-market range predicts first-hour US equity behavior and opening range execution.
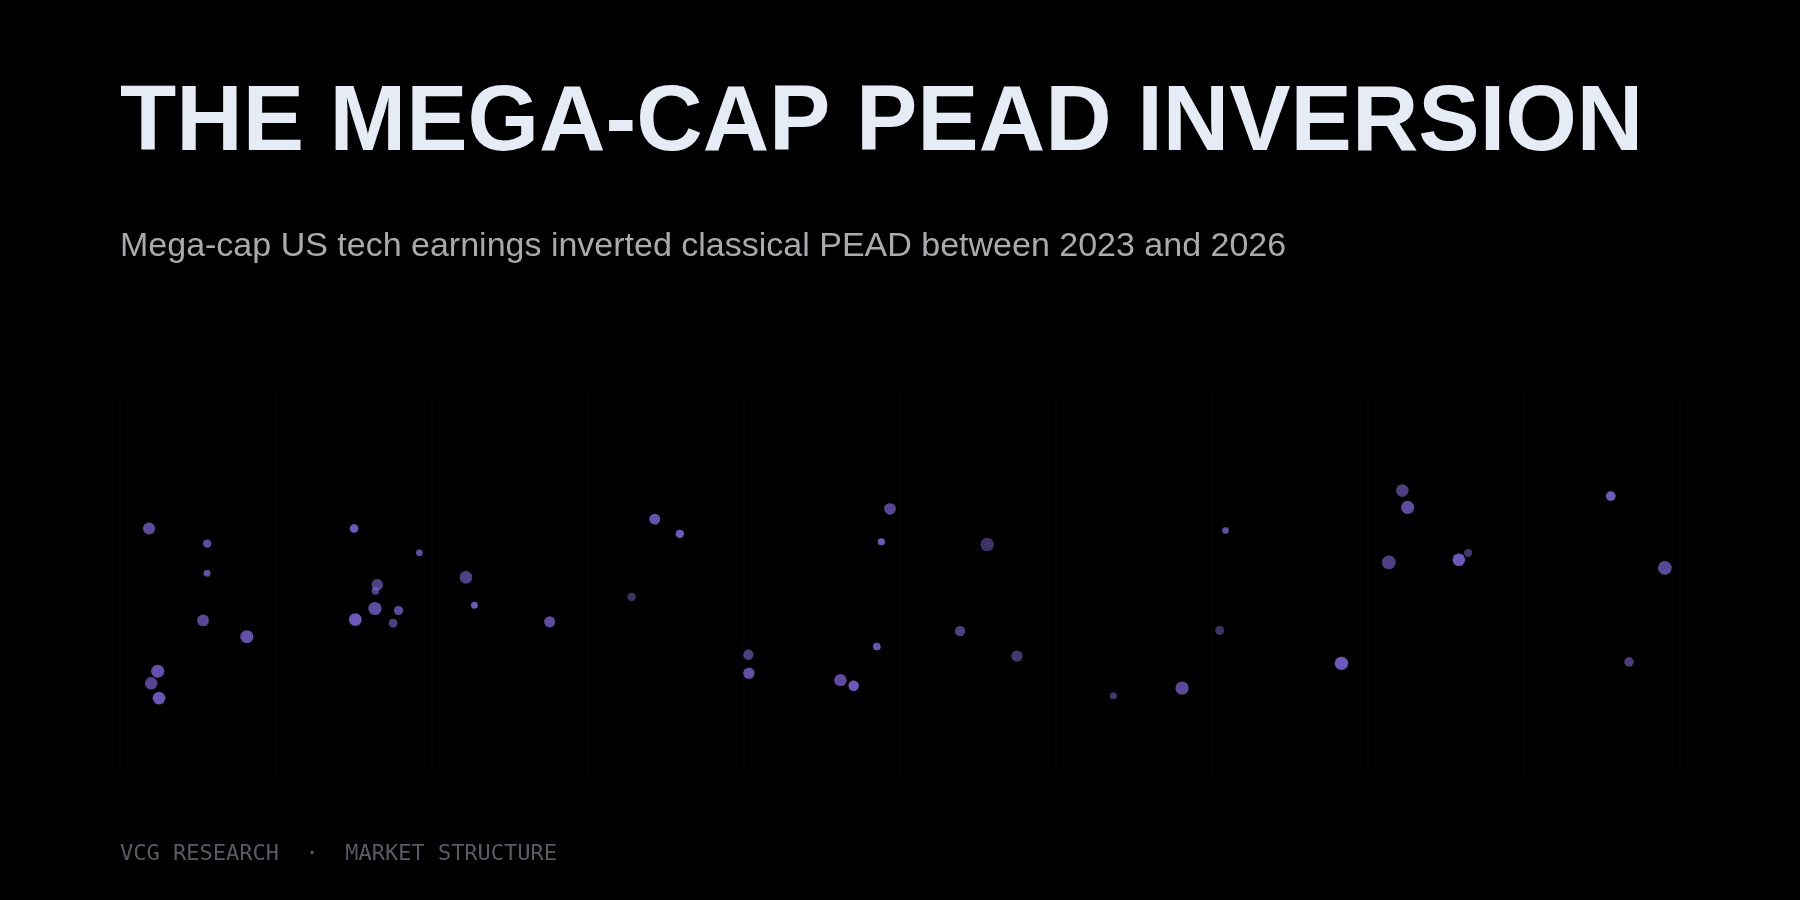
The Mega-Cap PEAD Inversion
Mega-cap US tech earnings inverted classical PEAD between 2023 and 2026. Strong reactions fade, weak ones bounce — and the reason is microstructural.
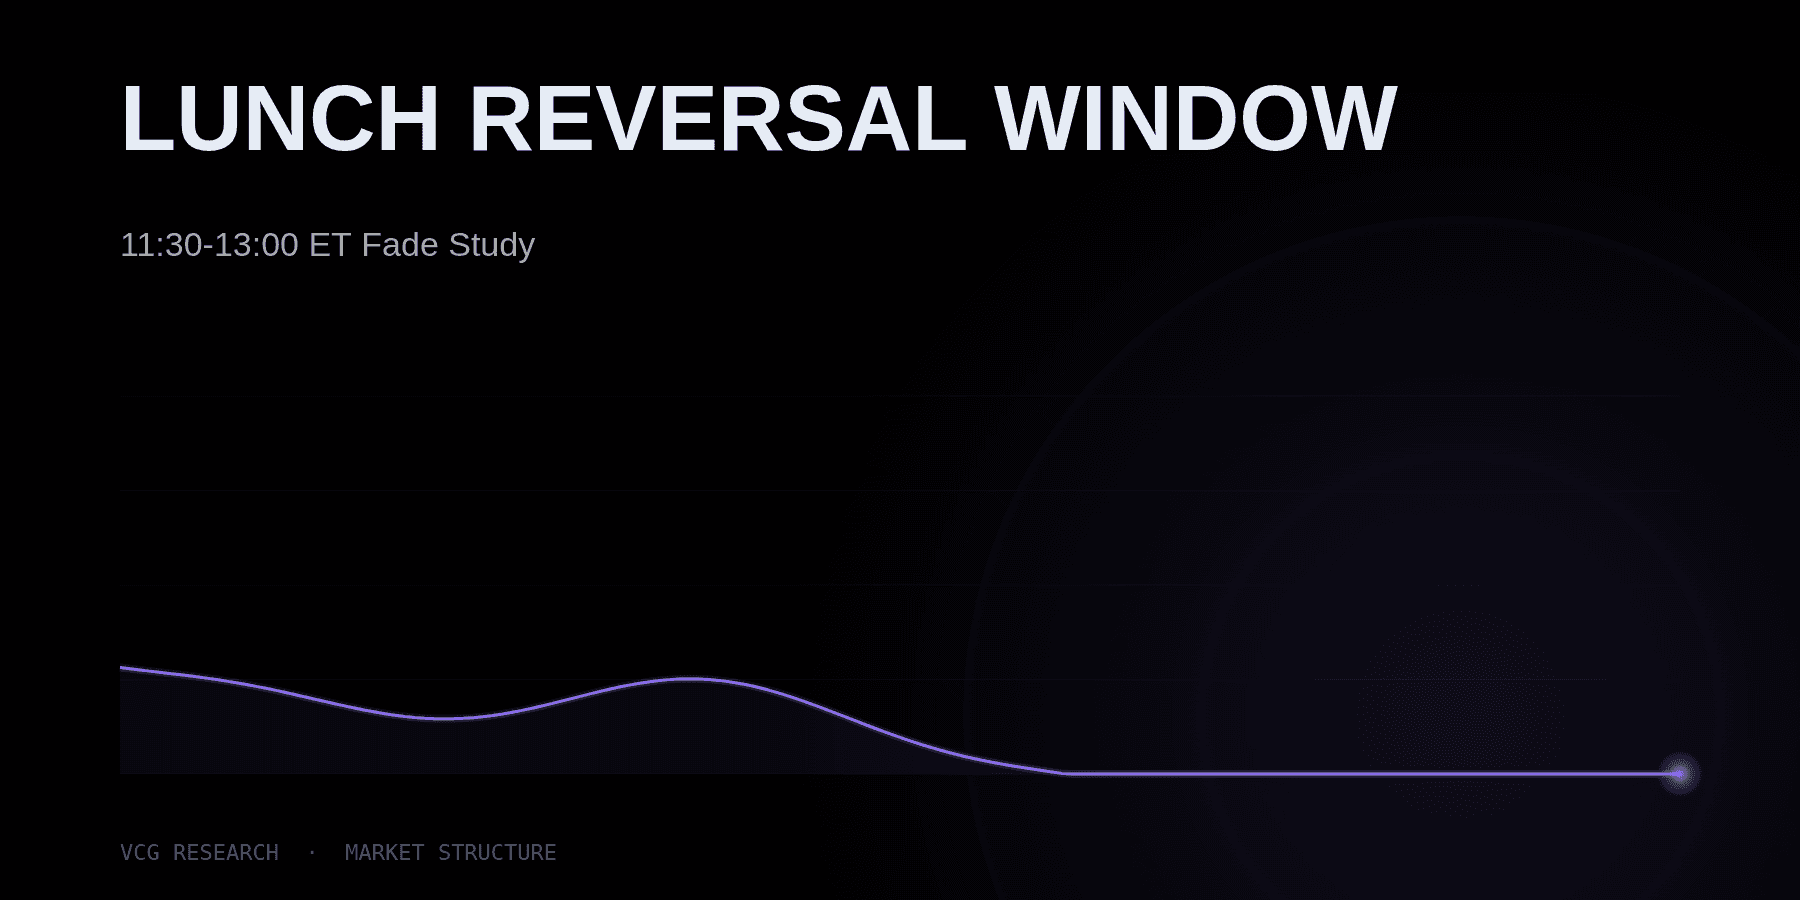
Lunch Reversal Window: 11:30-13:00 ET Fade Study
A Vortex study of why mid-size US equity morning drives often fade between 11:30 and 13:00 ET, with execution rules for active day traders.

The Gap Map: When US Equity Gaps Continue and Fade
A 6,552-event study of US equity overnight gaps. Large gaps fade, mid-size gaps drift, and the first 30 minutes tell you the regime.

10:30 VWAP Decision Point for Day Traders
How our firm uses sigma-distance from VWAP at 10:30 ET to frame end-of-day probability, route urgency, and risk for active US equity traders.

Opening Range Breaks That Actually Pay
A 60-day data study of 09:30–09:45 opening range breaks across SPY, QQQ, IWM, NVDA, TSLA. The pattern is sharply asymmetric by symbol and regime.

Why APAC Day Traders Are Moving to US Equities in 2026
APAC traders convert time-zone advantage into edge by trading the 21:30-23:00 local window — 4× the per-minute volatility of any other US session window.

Trading US Equities from Seoul: What Korean Day Traders Need to Know
Korean traders own one of the cleanest US-equity time zones. KOSPI predicts SPY gap size (not direction); first-5-min reversal data shows the asymmetry Korean traders systematically miss.
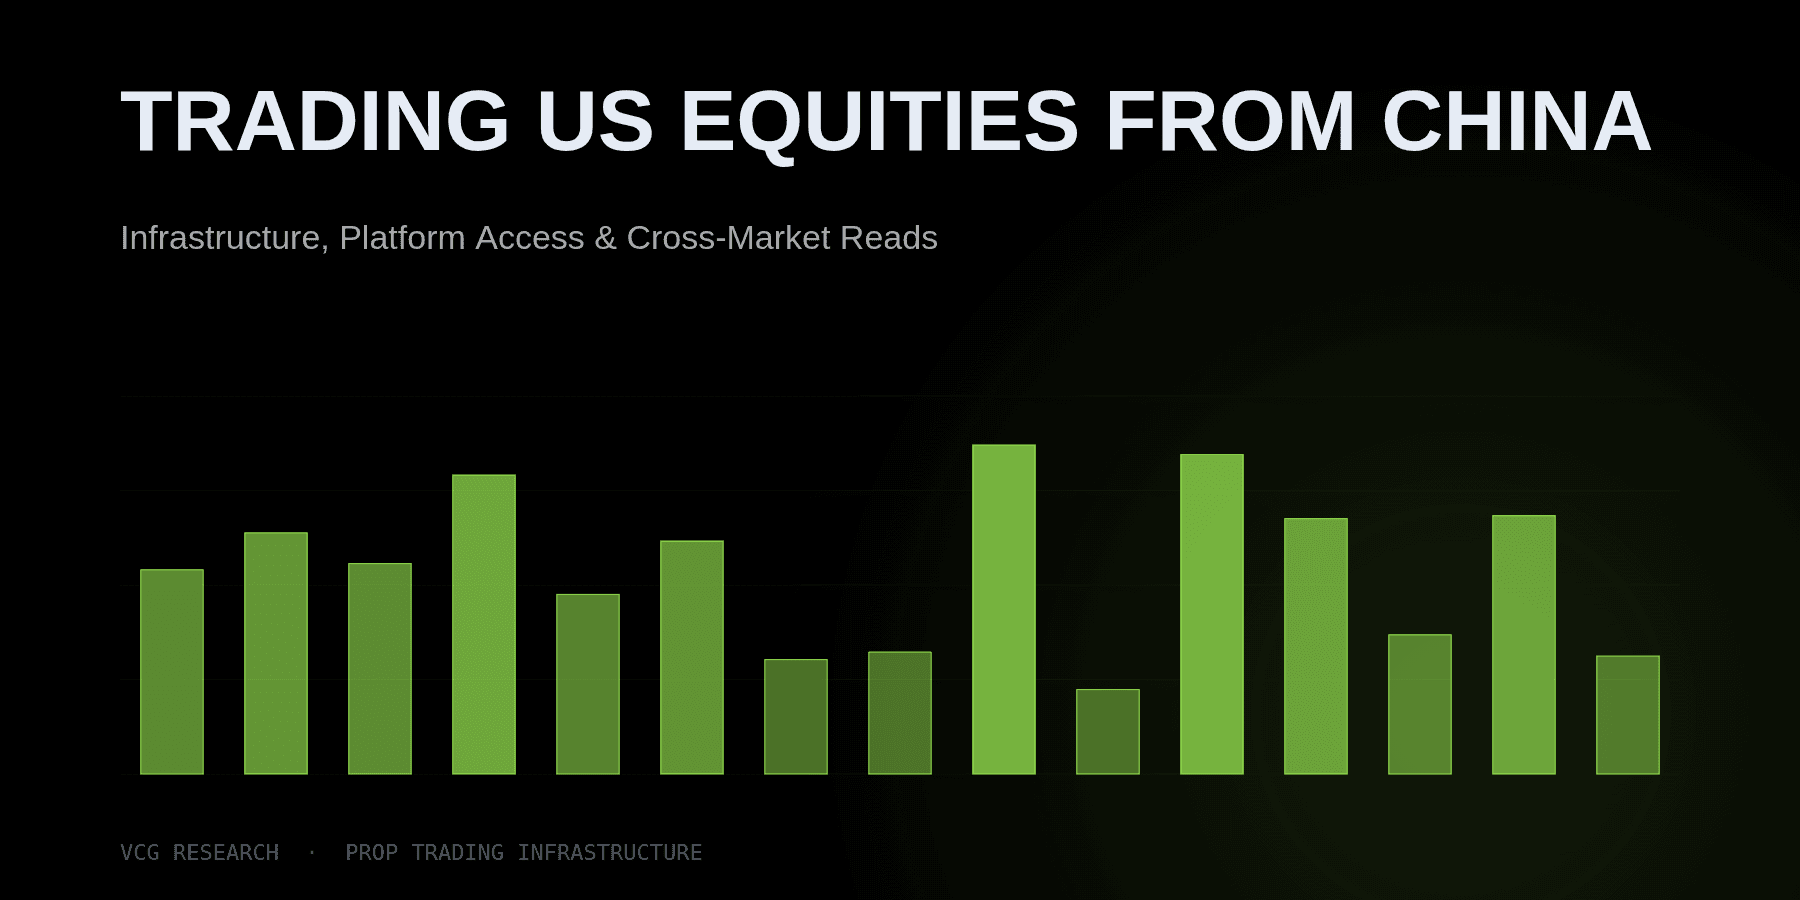
Trading US Equities from China: Infrastructure, Platform Access & Cross-Market Reads
What China-based active traders actually need to trade US equities professionally — DMA, HTB locates, multi-clearing, and the cross-session reads that earn the time-zone advantage.
The PFOF Tax: The Hidden Cost of Retail Execution for Active Traders
Zero commission isn't free. A 1-3 bp per-side route drag erases a real share of the 1-minute range on active strategies. How the desk measures implementation shortfall.

ORB Statistical Framework: Why the Long-Short Asymmetry Has Inverted
ORB framework's long-vs-short asymmetry has flipped in the current regime. Short ORB now 47% baseline / 50% with confirmation; long ORB only 31%. Data, mechanics, and desk rules.

Dark Pool Liquidity: When Prop Traders Route Off-Exchange
Dark pools aren't a magic edge — FINRA data shows off-exchange flow splits between ATS and wholesalers. A four-cost framework for when dark routing actually helps.
Multi-Clearing Firm Access: Why Borrow, Margin & Routing Improve
Multi-clearing access is operational edge on the days that matter most — borrow availability, margin formulas, route flexibility and recall response all vary by clearer.
Reading Level 2 Like a Prop Trader: Queue, False Depth, Refresh Behavior
What prop traders actually look at on Level 2 — queue refresh, false depth, asymmetric clearing, and the four questions before trusting displayed depth as a signal.

Hard-to-Borrow Mechanics: The Hidden Cost Layer in Short Selling
The complete framework for trading HTB names. Borrow tax curve, Reg SHO mechanics, term vs open borrow, recall risk, and the desk decision tree.

DMA vs Retail Broker Execution: Where Your Edge Actually Goes
Retail routing surrenders the most edge at the open and close — the windows active traders make 70% of P&L in. A data-driven framework for DMA, Rule 605/606, and venue choice.

Four HTB Vendors: Why Multi-Vendor Redundancy Is Short-Side Survival
One HTB vendor is a single point of failure on names like UPST, BYND and AMC. The operational case for four-vendor borrow redundancy and the workflow that delivers it.

Trading US Equities from Overseas: What International Prop Traders Should Evaluate
DMA quality, multi-vendor HTB, multi-clearing, real-time order flow — what international prop traders should actually evaluate when trading US equities from outside the US.

GWOFT: Global Weighted Order Flow Timing for Overseas US Equity Traders
GWOFT — session overlap map showing where overseas participation amplifies US tape speed. SPY 2.66 bp/min during EU overlap vs 1.36 bp/min mid-afternoon. Trade the overlaps.

VIX Implied Exhaustion Walls: Mapping Where Momentum Runs Out
SPY closes inside its VIX-implied 1-day band on 76-95% of sessions — except in stressed VIX regimes where the wall breaks down. A volatility-adjusted check on momentum extensions.

VIX Term Structure for Day Traders: When Volatility Is Fuel, Not Noise
VIX3M − VIX term spread separates calm-tape regime (contango, 94% of sessions) from stress regime (backwardation, 6%). Different rules in each. A 30-second pre-open check.

Basket Impact Ratio: A Better Tape Read for Sector Momentum Trades
Single-name divergence from sector ETF predicts next-day return non-linearly. Mild lead +0.15%, strong lead +0.03% — exhaustion shows up in the data, not just the chart.

Liquidity Packets: Reading Hidden Accumulation Before the Candle Confirms
Liquidity packets — how prop traders read order-flow bursts as accumulation vs exhaustion before the chart confirms. CVD, refresh, trade-size distribution and the prop-grade framework.

The 09:45 Dead Zone: Why Good Breakouts Fail After the Opening Sweep
The 09:45-10:15 ET window is where most ORB breakouts fail. Current regime shows downside breaks reverse aggressively while upside breaks reverse less reliably. Trade the failed retest.
International editions
Selected research published for our international trading community.