
The 09:30–09:45 Auction: Opening Range Breaks That Actually Pay
- 4 days ago
- 4 min read
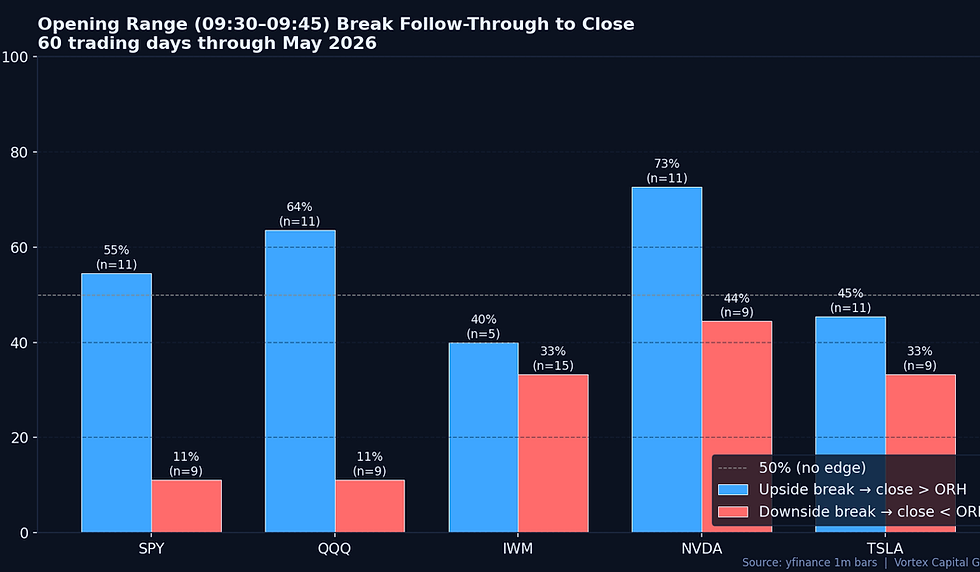
TL;DR — We tested opening-range breaks (09:30–09:45 ET) across SPY, QQQ, IWM, NVDA and TSLA over the last 60 trading days. NVDA upside breaks followed through to the close 72.7% of the time. QQQ: 63.6%. SPY: 54.5%. Downside breaks in index ETFs essentially didn't follow through in this regime. The pattern is sharply asymmetric by symbol — and the symbol selection happens before the bell, not after.
The Opening Range Breakout is one of the oldest day-trade structures still being taught, and one of the most context-sensitive. It works beautifully in some symbols and some regimes, and acts as a liquidity trap in others. The reason newer traders alternate between worshipping and abandoning it is simple: they apply the same rule to every symbol on every day. The data doesn't.
How we ran the test
We pulled one-minute OHLCV from yfinance for SPY, QQQ, IWM, NVDA and TSLA across the last 60 trading days through May 13, 2026. The opening range is defined as the high and low printed between 09:30 and 09:45 ET. For every session, we recorded whether the post-09:45 tape broke the range high first, the range low first, or held the range — and then measured whether the session closed beyond the broken level. A clean test of "did the break follow through to the close."
The 60-day window is sharply asymmetric
NVDA upside breaks followed through 72.7% of the time (n=11), with an average session return of +1.33%. Downside breaks followed through 44%.
QQQ upside breaks followed through 63.6% (n=11, +0.46% average day). Downside breaks held only 11%.
SPY upside breaks followed through 54.5% with a modest +0.12% average day. SPY downside breaks: 11% follow-through.
IWM and TSLA were the laggards. IWM upside follow-through was 40%, TSLA was 45.5%. Both still had positive average day-returns when an upside break occurred — but the rate is low enough that selectivity matters.
Why the asymmetry exists
The 60-day window covered a market trending higher with concentrated leadership in mega-cap tech. The downside-break failure rate in SPY and QQQ (11%) isn't a stable property of the strategy — it's what a one-way tape looks like under this test. The point isn't that downside breaks "don't work." The point is that the same nominal pattern is producing two completely different expectancies depending on symbol and regime.
The single-name asymmetry is more durable. NVDA and TSLA carry consistently larger morning relative volume and tighter intraday autocorrelation than index ETFs because their opening flow is concentrated in a smaller participant pool: options dealers hedging gamma, momentum-tilted funds rebalancing, and retail flow coordinated by social signal. When the opening range breaks in those names, the same flow that drove the break tends to extend it. When it breaks in IWM, the next minute can be driven by a completely different basket of 2,000 small-caps.
What this isn't
This isn't a signal. A 72% follow-through rate over 11 events is suggestive, not conclusive. The honest read: opening-range breaks in concentrated, high-gamma single names carry a measurable directional bias in trending regimes, and that bias is large enough to be tradable if execution costs are controlled. It's not a number we size aggressively against on the first occurrence.
How we trade the opening auction
Symbol selection comes before pattern recognition. Our Vortex Edge ranker scores names by realized volatility and relative volume every morning. The opening range is only worth trading in symbols where the range itself is wide enough to carry asymmetric reward relative to the spread and the typical false-break excursion. On a quiet day in IWM, that condition isn't met — regardless of how the chart looks.
Confirmation is order flow, not price. A break of the 09:45 high is one piece of information. Whether CVD is confirming, whether VWAP is sloping with the break, and whether the heatmap shows resting size getting lifted versus pulled — these decide whether we participate. Vortex Flow turns the break into a confirmed continuation read instead of a candle.
The route is the trade. The opening 15-minute window is the highest-cost liquidity window of the day. Marketable orders at 09:46 pay structurally more spread than the same orders at 10:30. Our DMA through Sterling Trader Pro — hidden, ISO and pegged order types — is the difference between a winning expectancy and a flat one on this kind of strategy.
Asymmetric sizing. Because upside breaks in this regime had a meaningfully different follow-through rate than downside breaks, position size and stop discipline aren't symmetric either. Treating the two as mirror images is exactly the mistake that produces slow bleed.
The takeaway
The opening range isn't a strategy — it's a context. The pattern earns its keep in concentrated single names with high morning participation under trending conditions, and it fails as a one-size-fits-all rule in broad ETFs or in chop. The traders we work with run it consistently because they decide which symbols qualify before the bell, treat order flow as the confirmation, and route into the auction without paying for liquidity twice.
Vortex Capital Group provides qualified traders with the symbol-ranking, order-flow analytics and DMA infrastructure required to trade microstructure-sensitive patterns like the opening range with institutional discipline.


Comments